Delfini Logo
Delfini: AI-Ready Data Management for Life Sciences

Getting Started

Desktop Quickstart

Before We Begin

Delfini is currently in private beta with near-term plans for public open-source release. To join the private beta, please contact delfini@bioteam.net.

The instructions below assume you have some familiarity with the command line.

First, you will need to have Docker installed on your computer.

Next, configure authentication to the GitHub Container Registry:

  1. Visit https://github.com/settings/tokens.

  2. Click Generate new token and select (classic).

    1. Provide the note “Docker ghcr.io”
    2. Select an appropriate expiration date
    3. Select the read:packages scope
    4. At the bottom, click Generate token
  3. Copy the resulting token to your clipboard.

  4. In the terminal, enter docker login ghcr.io -u USERNAME where USERNAME is your GitHub username. When prompted, paste in the token from the previous step.

  5. If successful, you should see the message Login Succeeded. For any issues, refer to GitHub’s documentation.

Download the latest container image

In your terminal, run:

docker pull ghcr.io/bioteam/delfini:main

Run the Delfini container

Delfini uses an instance folder to hold its configuration and any uploaded data. The suggested first steps will save this folder in temporary storage. For a more persistent setup, see the instructions at the end of this document.

For your first try with Delfini, run:

docker run -t -p 3000:3000 ghcr.io/bioteam/delfini:main

Then, in a web browser, visit http://localhost:3000/.
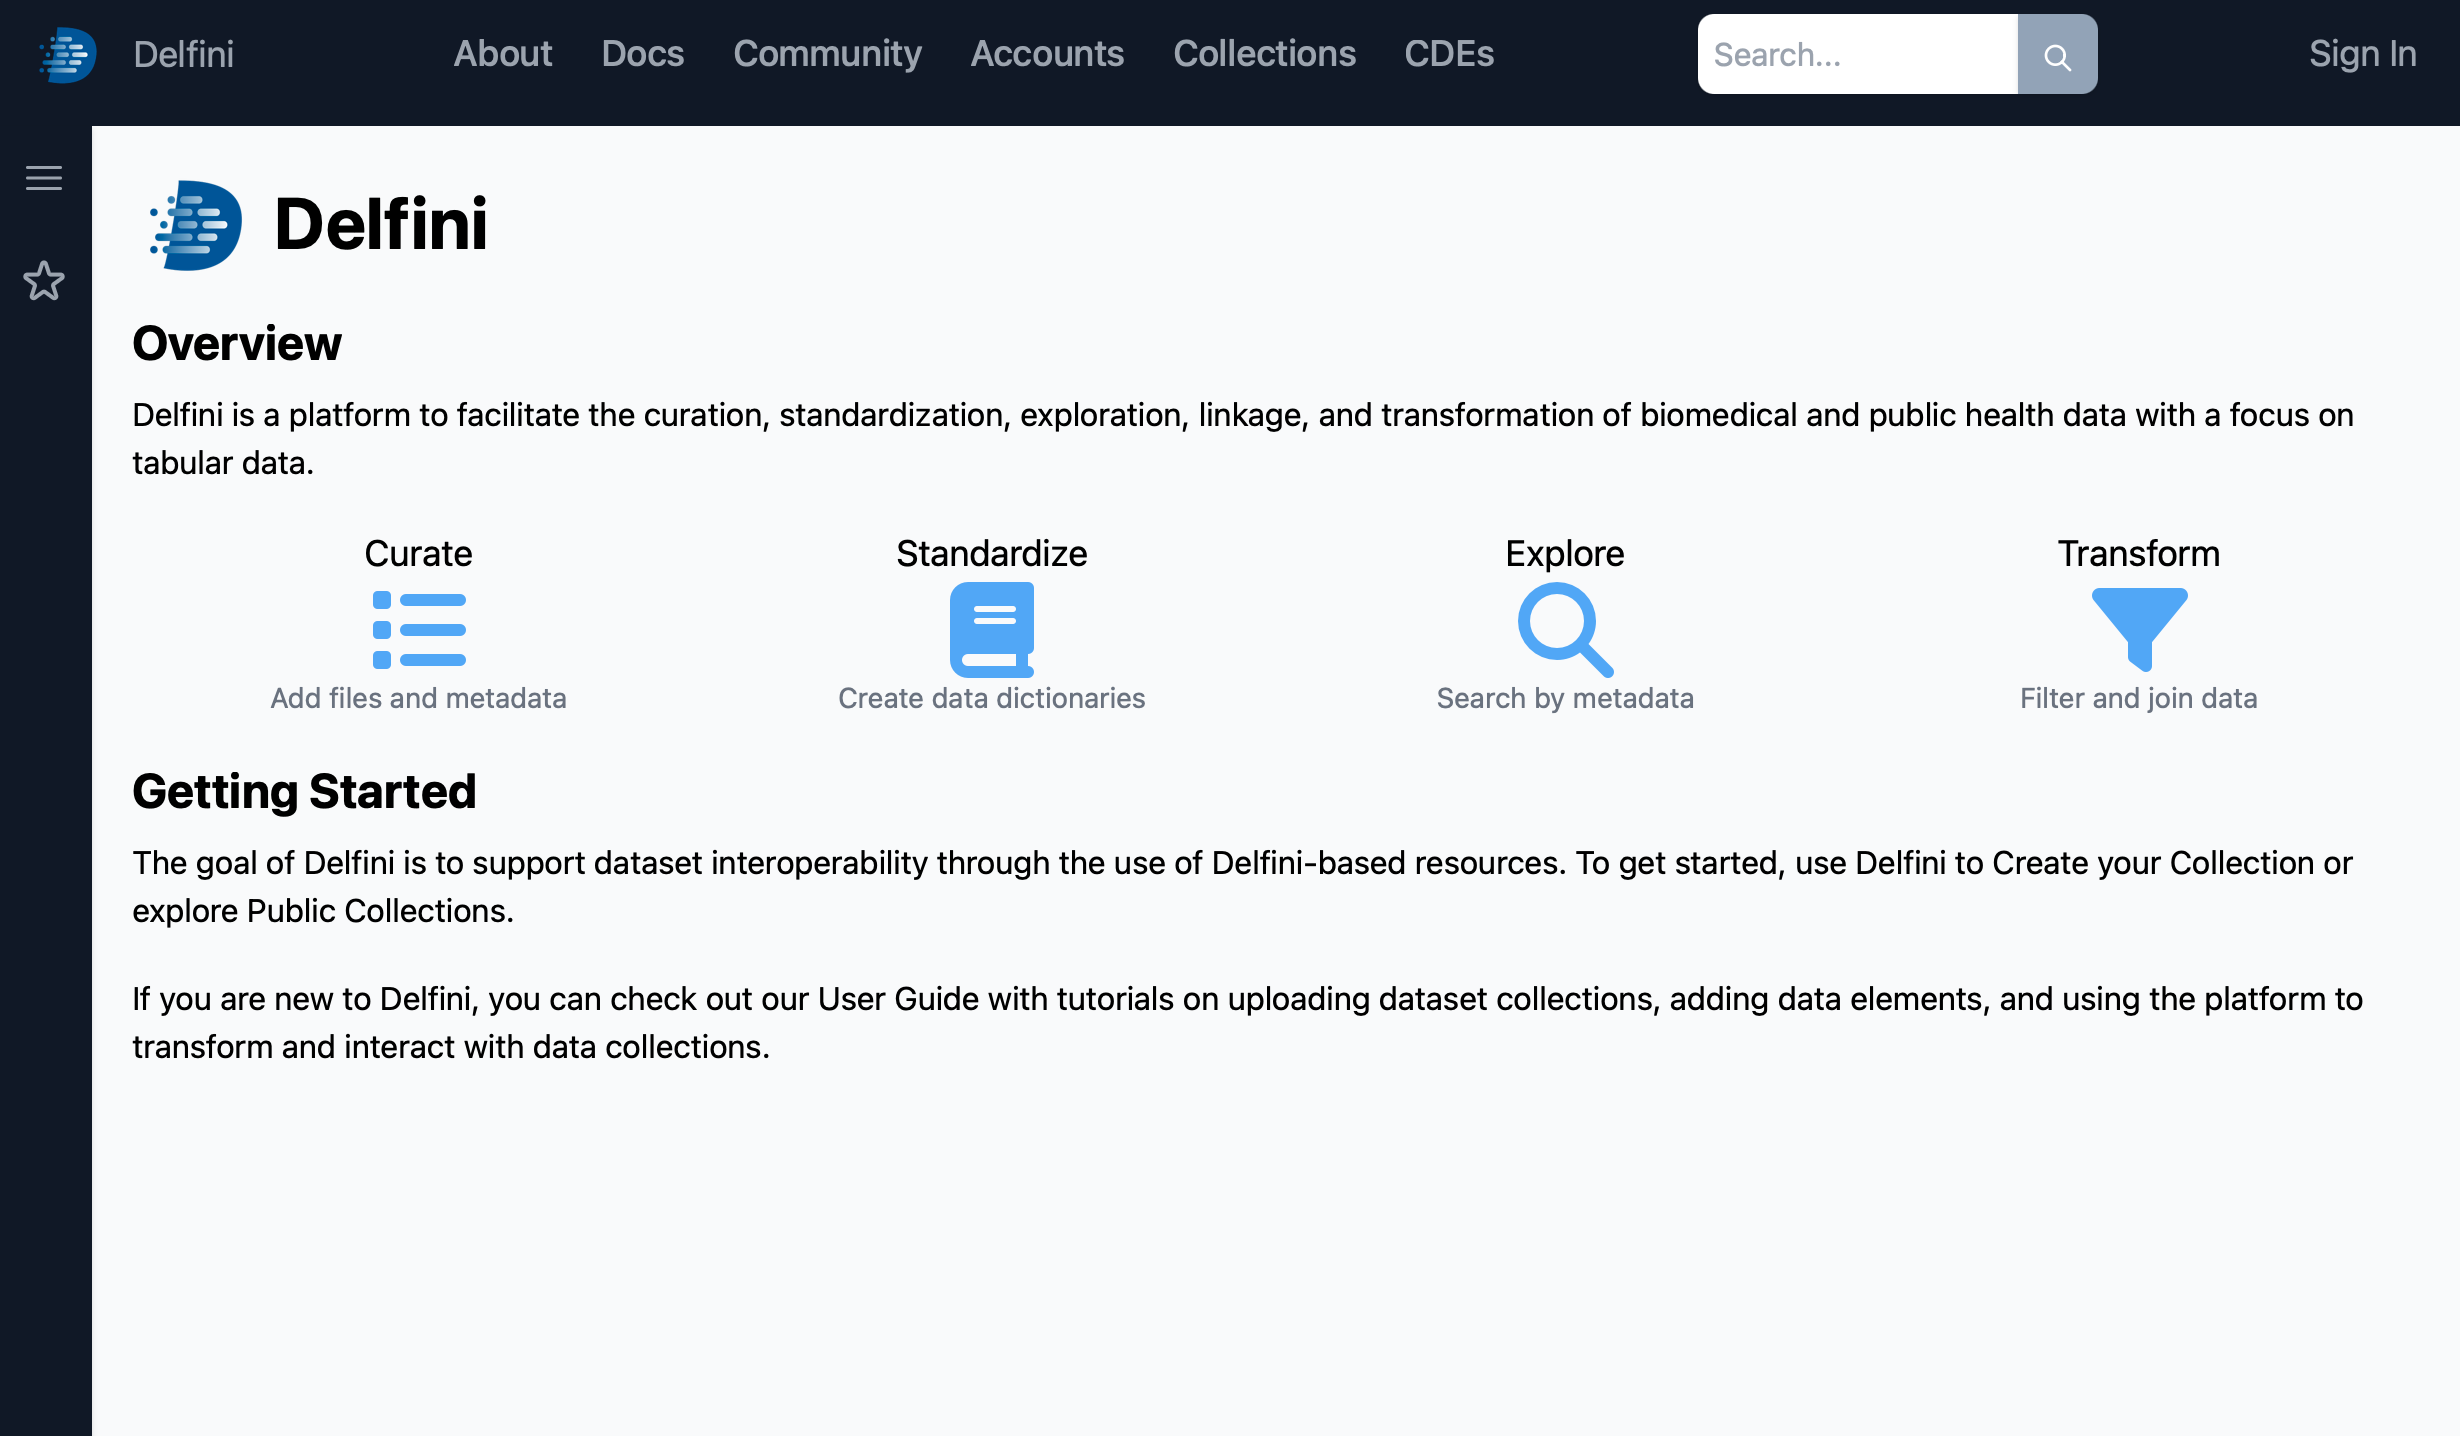
Delfini main page

Your first steps with Delfini

Congratulations, you’ve successfully gotten your own instance of Delfini up and running! This instance has all of the core features of Delfini, including support for CDEs, data transformations, and federation. Follow the steps below to get started with a quick example.

Logging In

Begin by creating a new user account by visiting http://localhost:3000/login/signup and providing some basic user details.

Creating a new user

The first account that is created on a new Delfini instance will automatically receive full admin privileges.

Once you’re logged in, you’ll be taken straight to the Collections page.

Delfini Collections

Creating a Collection

Click on My Collections, then click Create New Collection to create your first collection.

Provide whatever name you’d like; the description and tags are optional. Click Submit at the bottom to continue.

Collection Main Page

Linking to External Data

At this point, you could feel free to browse around, explore, and even upload your own data to begin experimenting with Delfini’s features. However, if you’re looking for an easy start, we can link to some simple public data that showcases Delfini’s data exploration and transformation features.

Begin by expanding the Data Items dropdown, then click New, followed by New Link… Paste in the following URL as a link:

s3://1000genomes/20131219.populations.tsv

And click Create to create the link. You should see it appear in your data items list.

Click on the newly created item to view it.

Tabular data item

Data Manipulation and Transformation

At this point, if you scroll through the tabular data, you’ll notice a few things. First, the data table includes a “Total” row and some blank rows at the end. These will cause some strange results when we explore data visualizations later, so it would be best to filter these out. Also, while the Population Code has a corresponding description, the Super Population does not. To correct these issues, we’ll use a Dataview to create a transformed representation of this dataset.

Dataviews are always created in reference to a source data item, so the easiest way to create a new dataview is to click the Item Operations menu in the upper right, then choose Create Dataview… Give it a name such as “Population Mapped”, then click Create Dataview.

You’ll be taken to the Dataview Explorer view, where you can see the structure of the newly created dataview and a preview of its results.

By default, the dataview will include a “Take 10 rows” step, which will limit the output of the dataview to just 10 rows. This is sometimes helpful to leave in place when doing initial explorations on large datasets, but for this example, you can delete this step by hovering over it and clicking the Delete icon in the upper right.

To begin building our dataview, we’ll filter out the unneeded rows. Click Add Step, then choose Filter Rows. The new step will appear. Choose to filter by Population Code, and set the operation to is not null.

The dataview preview always only shows the first 25 rows of the result. Since the rows we wanted to filter out are past that point (at the very end of the data table), we won’t be able to see the change in the preview, but if you’d like, feel free to click Save Dataview now and then click the Table tab at the top to see the full results.

The second operation we’d like to perform is mapping the Super Population code to a readable value. To do this, click Add Step again, and choose Map Column.

Add a Map Column step

To configure the new step, choose Super Population as the Source Column, toggle to select the target column as a New column, and enter the new label as Super Population Description. Finally, configure the value map by entering the following source and target values, clicking the + button after each:

Source valueTarget value
EASEast Asian
SASSouth Asian
AFRAfrican
EUREuropean
AMRAmerican

Map Column step configured

You should now see that the dataview shows the new column, if you scroll down and scroll the preview to show the rightmost column. By default, new columns are added to the right of existing columns.

Show the dataview preview

However, it’ll be easier to use this data if we re-order the columns so that the description is adjacent to the existing code. We can do this by adding a Select Columns step. This step will allow us both to choose which columns we want in the output, as well as drag-and-drop to change their order. Click Add Step, then choose Select Columns. Click the Add All button, then in the Selected Columns set, scroll to the bottom, and grab the two-lines (=) handle to drag it up and drop it next to the existing Super Population column.

Now when you scroll down to see the dataview preview, you’ll see the columns in the desired order.

Dataview preview after select

Finally, we’ll click Save Dataview to ensure that we’ve saved our work. To confirm, click the Table tab and browse the full data table.

Dataview table view