At this point, if you scroll through the tabular data, you’ll notice a few things. First, the data table includes a “Total” row and some blank rows at the end. These will cause some strange results when we explore data visualizations later, so it would be best to filter these out. Also, while the Population Code has a corresponding description, the Super Population does not. To correct these issues, we’ll use a Dataview to create a transformed representation of this dataset.
In Delfini, data transformations are always non-destructive and preserve lineage with their upstream data sources. This maximizes understanding of intent and reproducibility. Delfini is capable of applying transformations that can be expressed as a database query; for operations requiring more computation capability, consider integrating Delfini with an external compute platform.
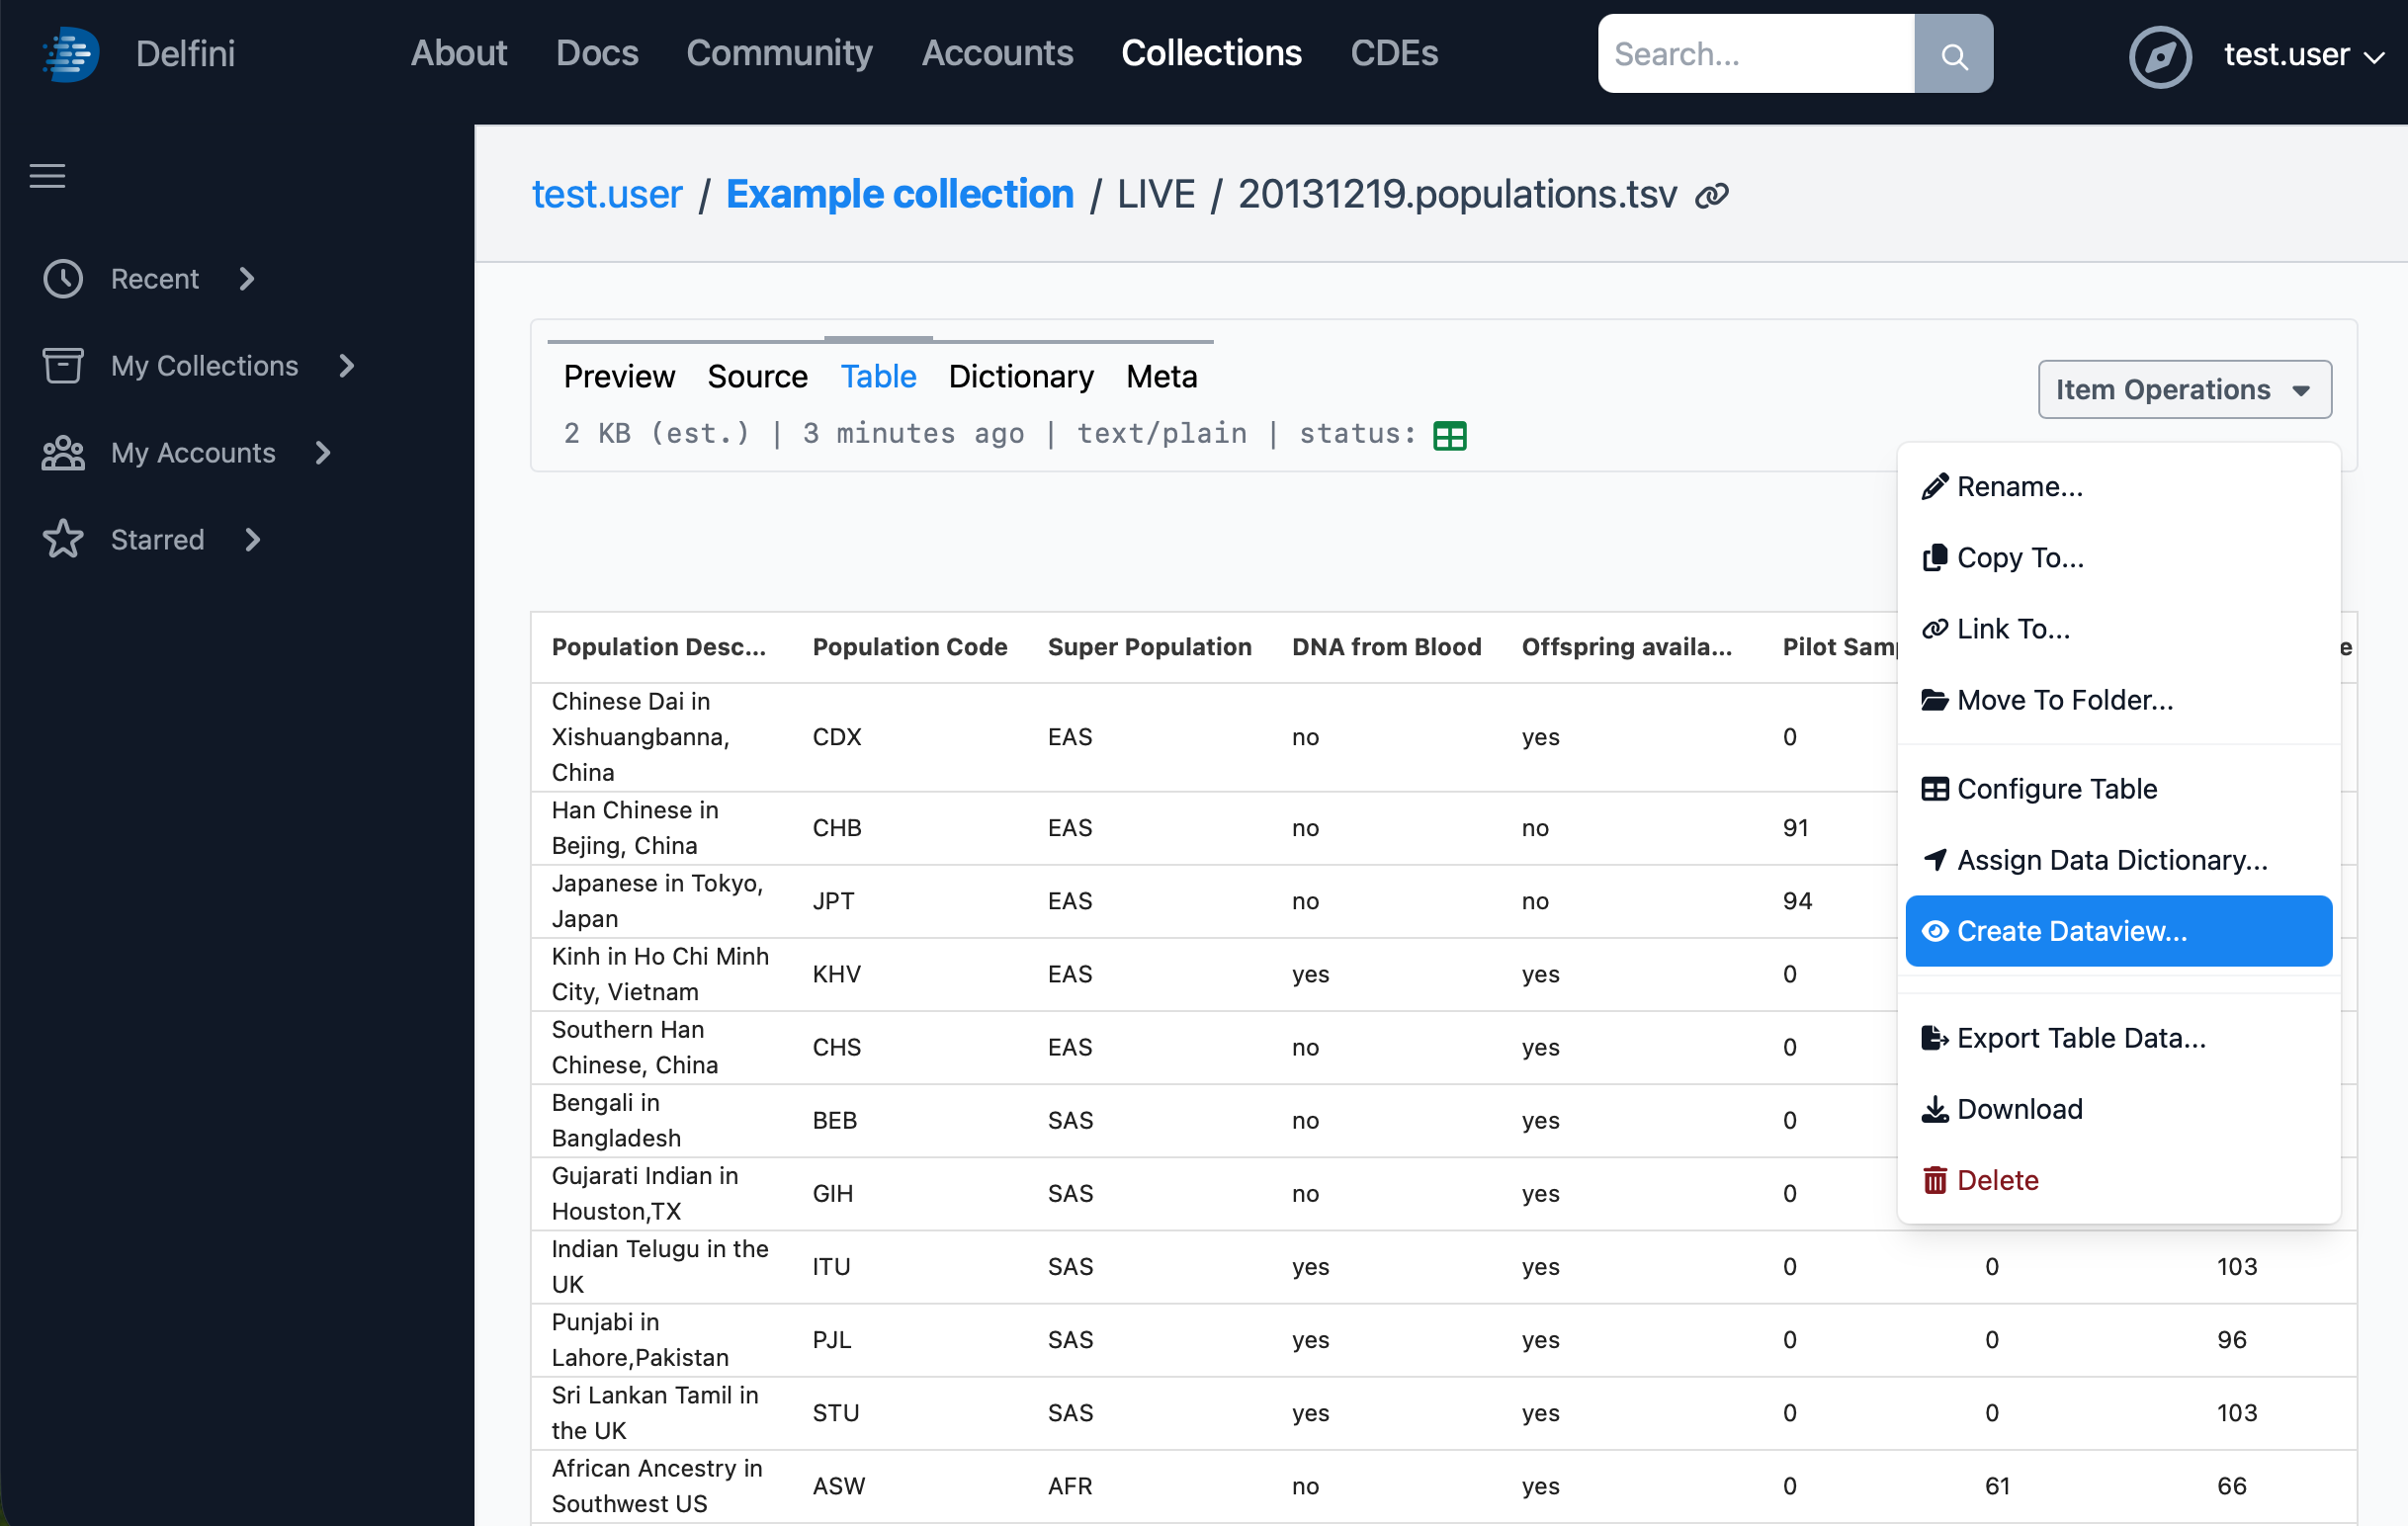
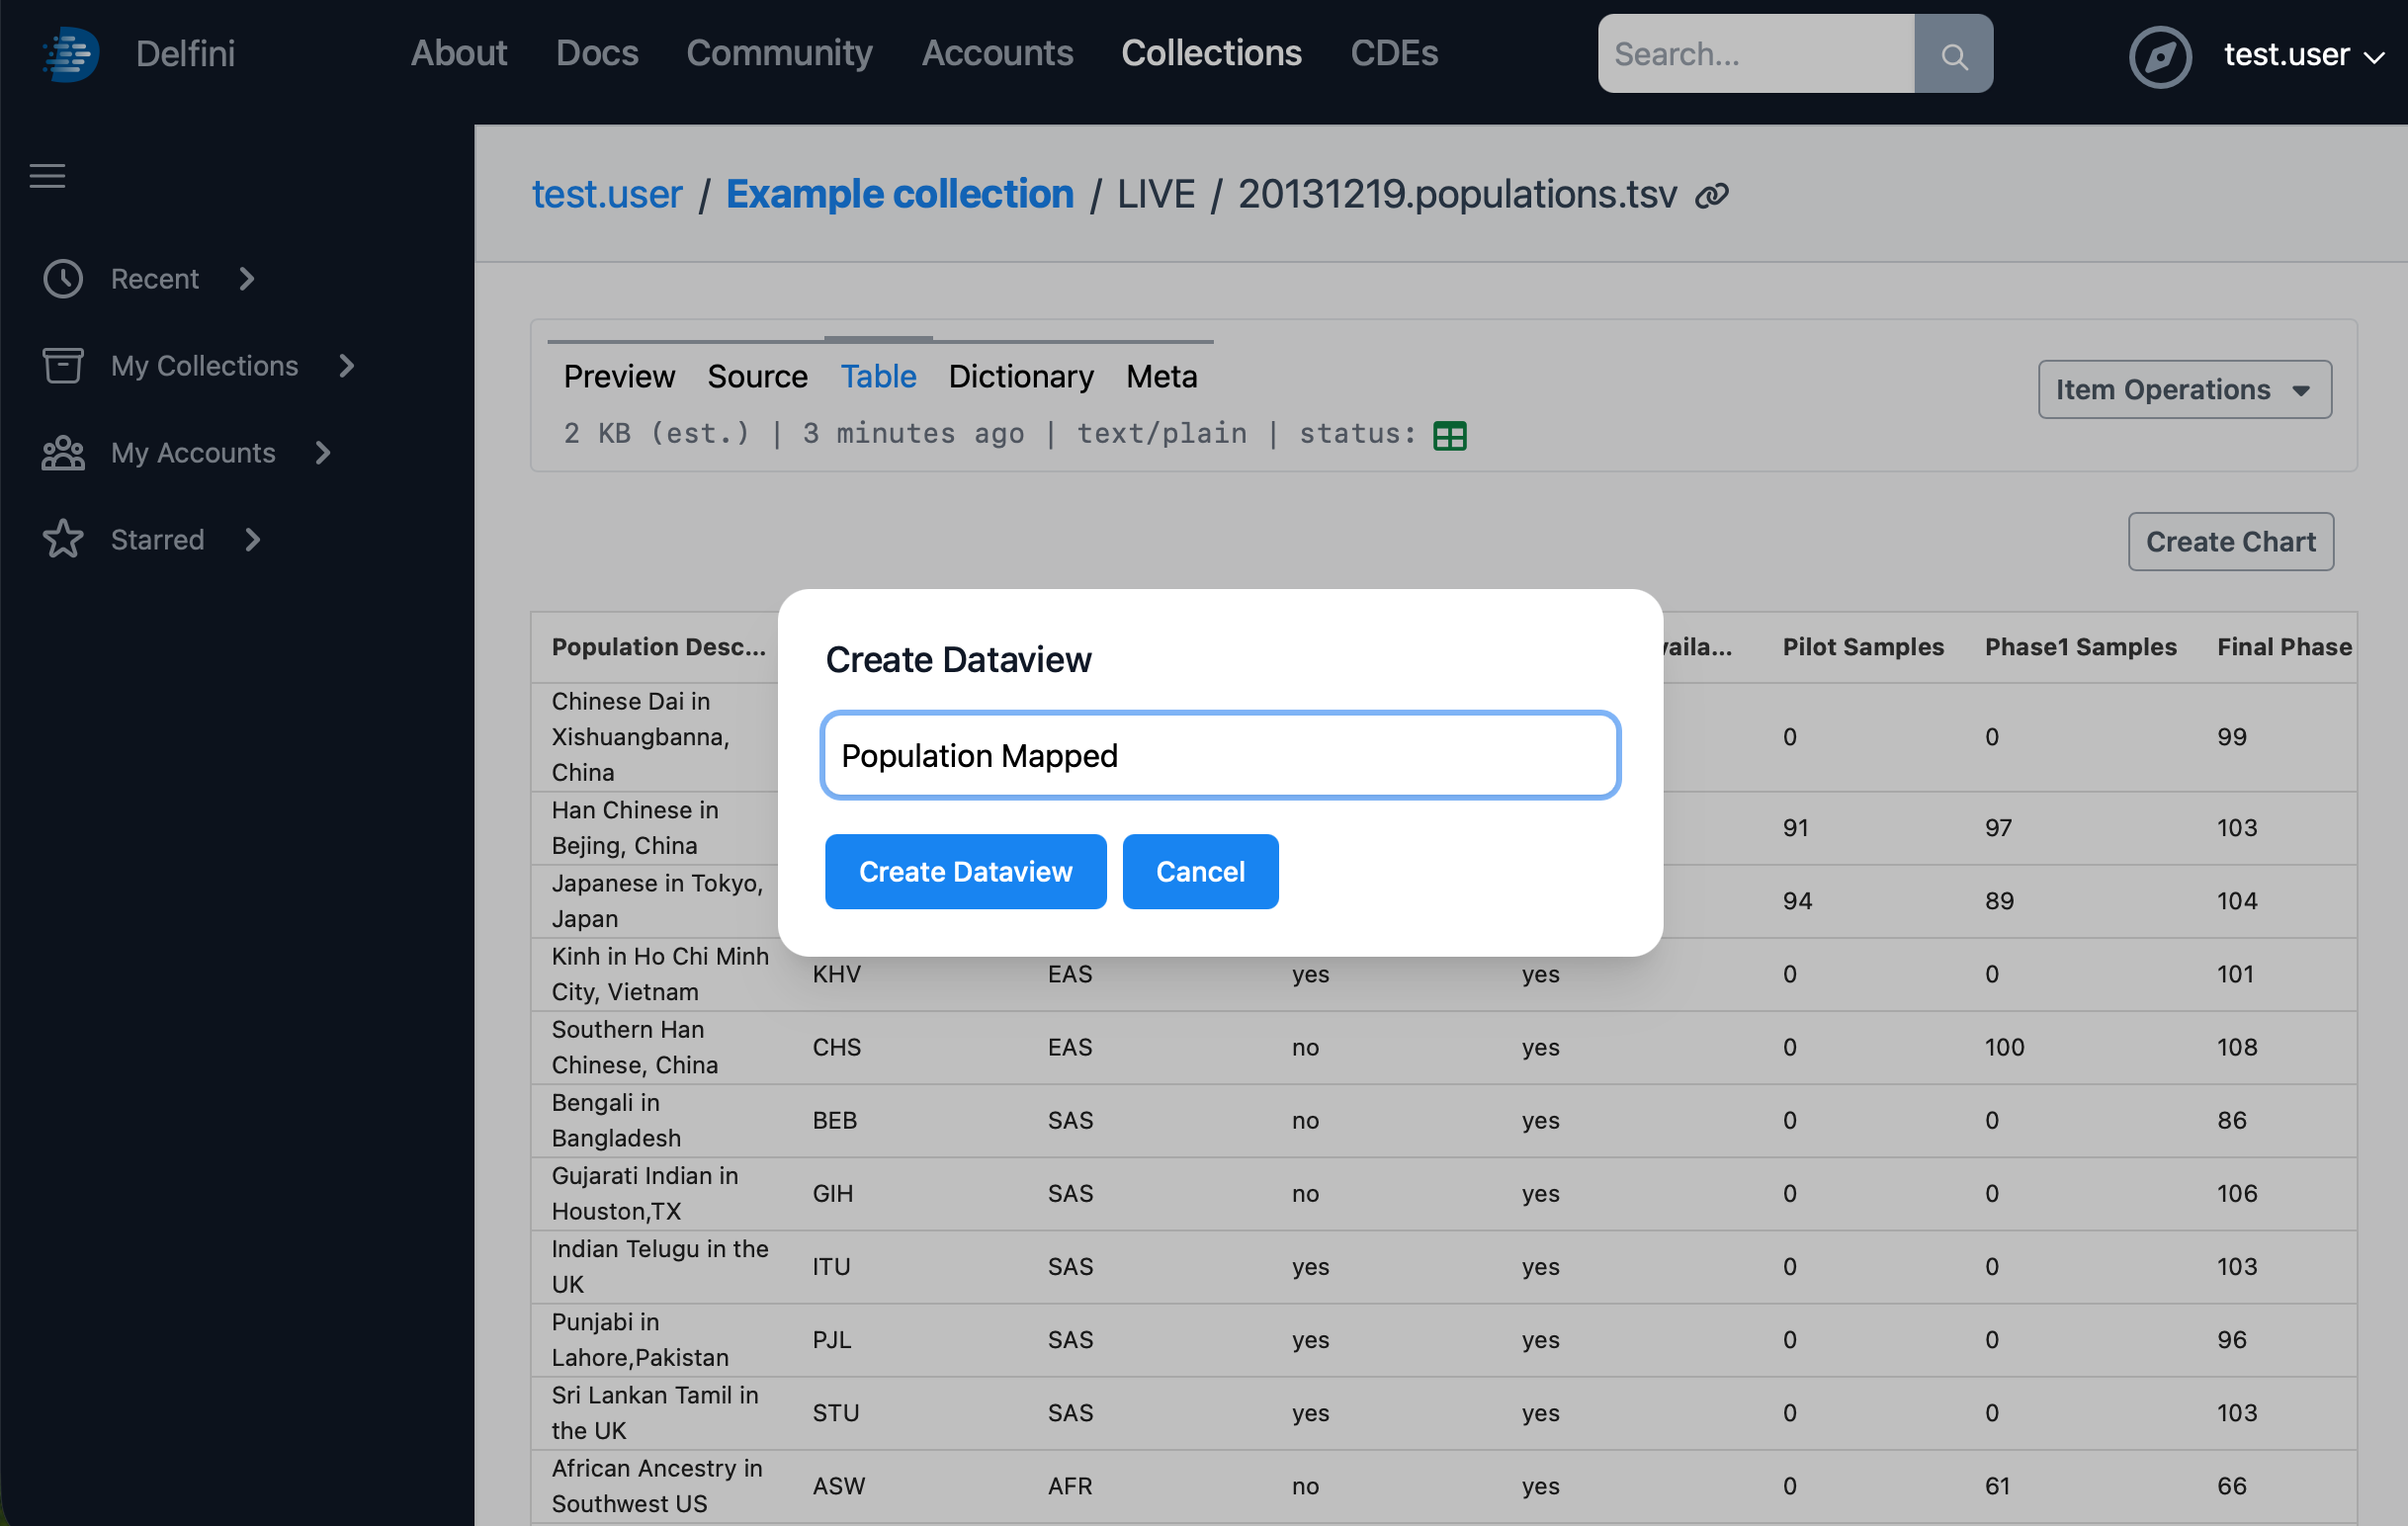
Dataviews are always created in reference to a source data item, so the easiest way to create a new dataview is to click the Item Operations menu in the upper right, then choose Create Dataview… Give it a name such as “Population Mapped”, then click Create Dataview.
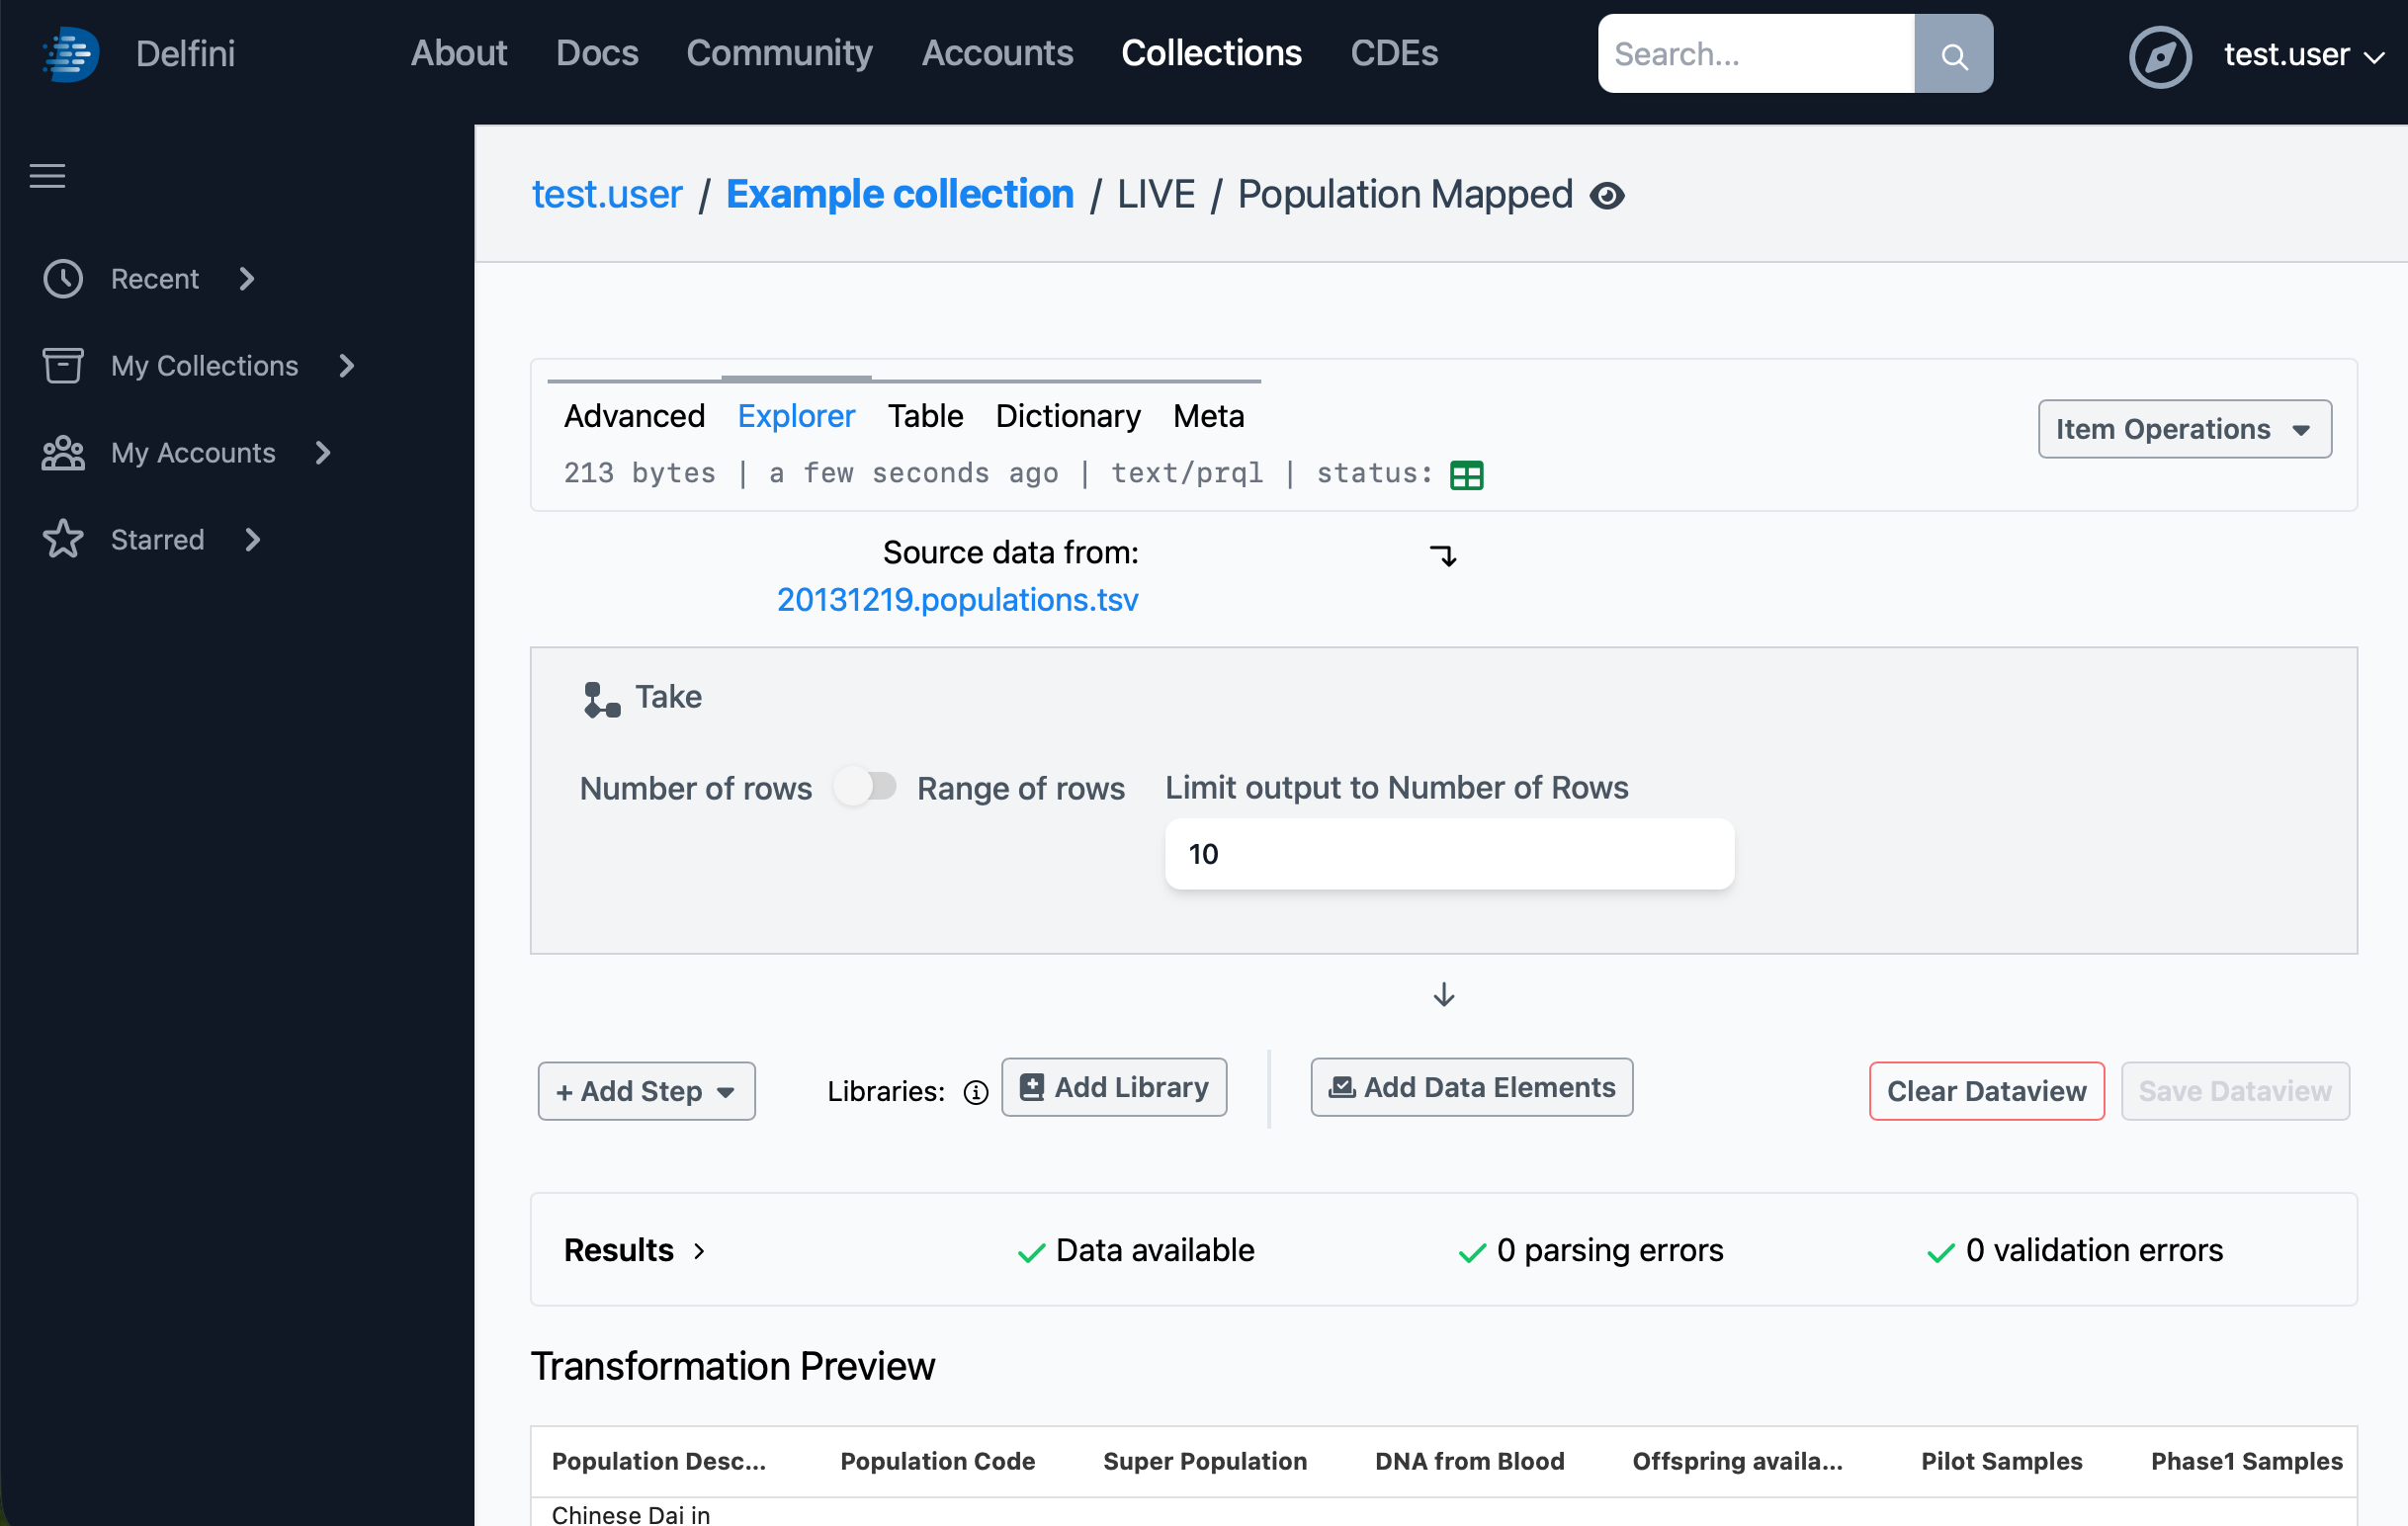
You’ll be taken to the Dataview Explorer view, where you can see the structure of the newly created dataview and a preview of its results.
By default, the dataview will include a “Take 10 rows” step, which will limit the output of the dataview to just 10 rows. This is sometimes helpful to leave in place when doing initial explorations on large datasets, but for this example, you should delete this step by hovering over it and clicking the Delete icon in the upper right.
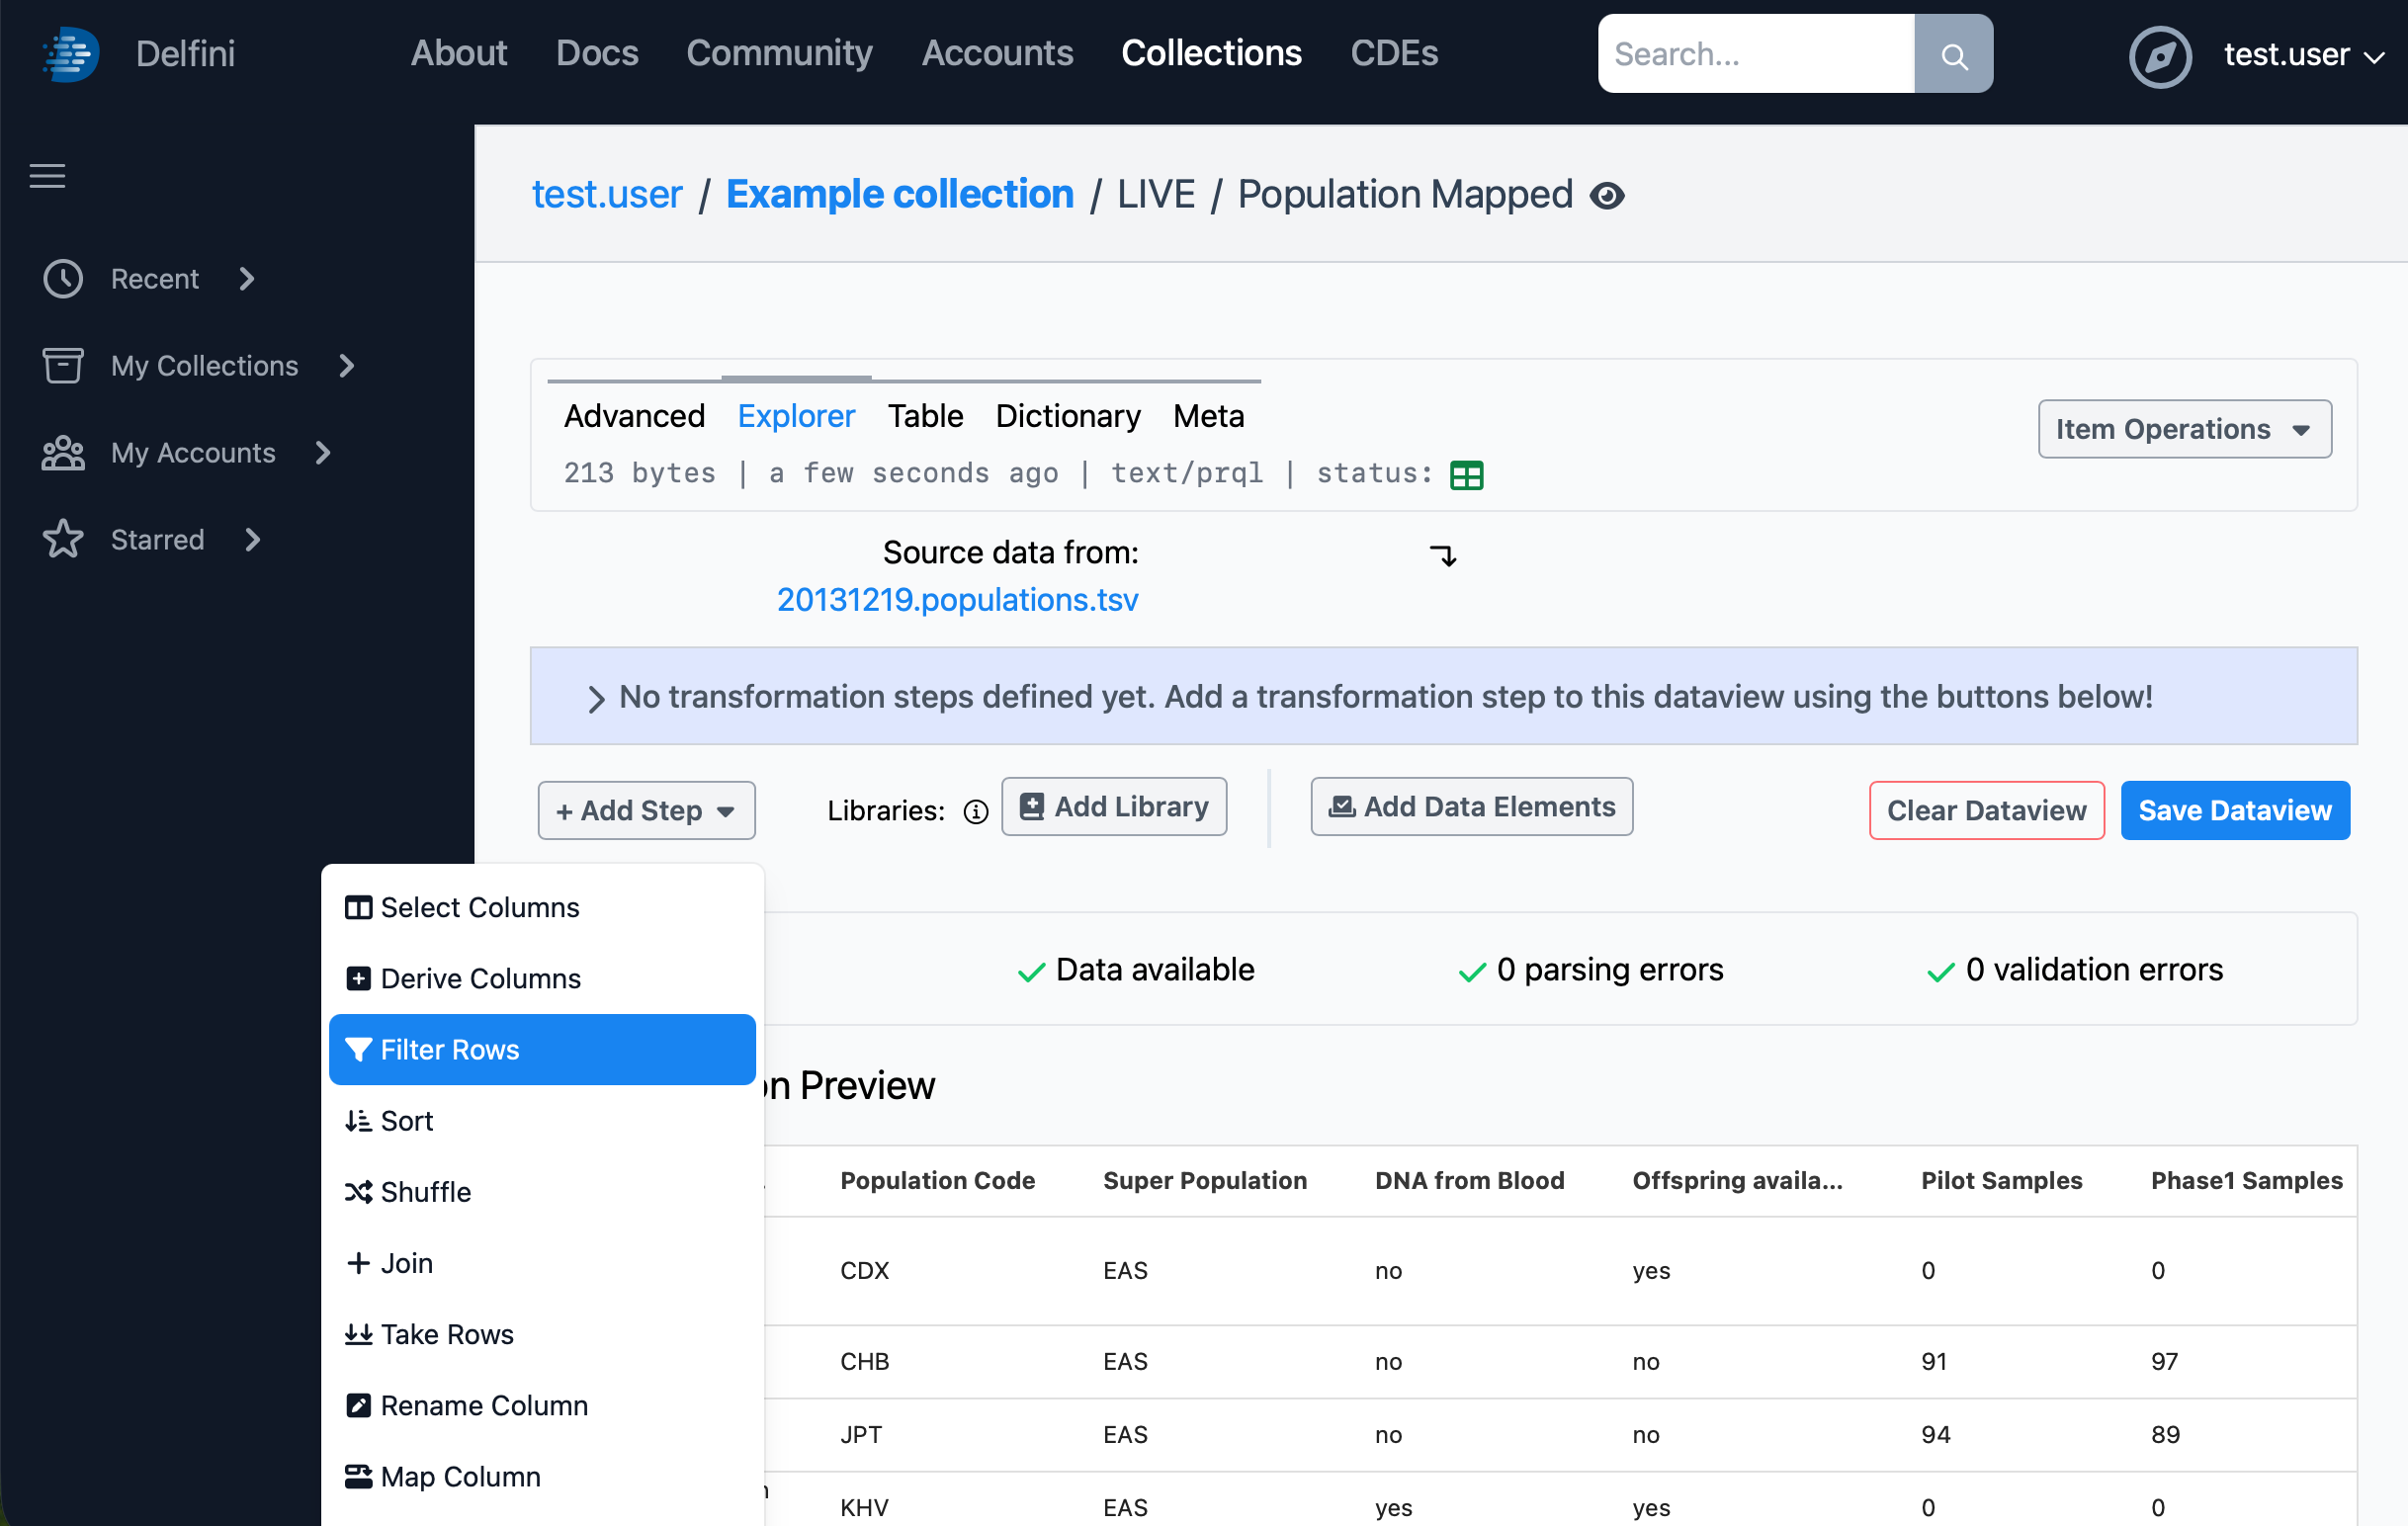
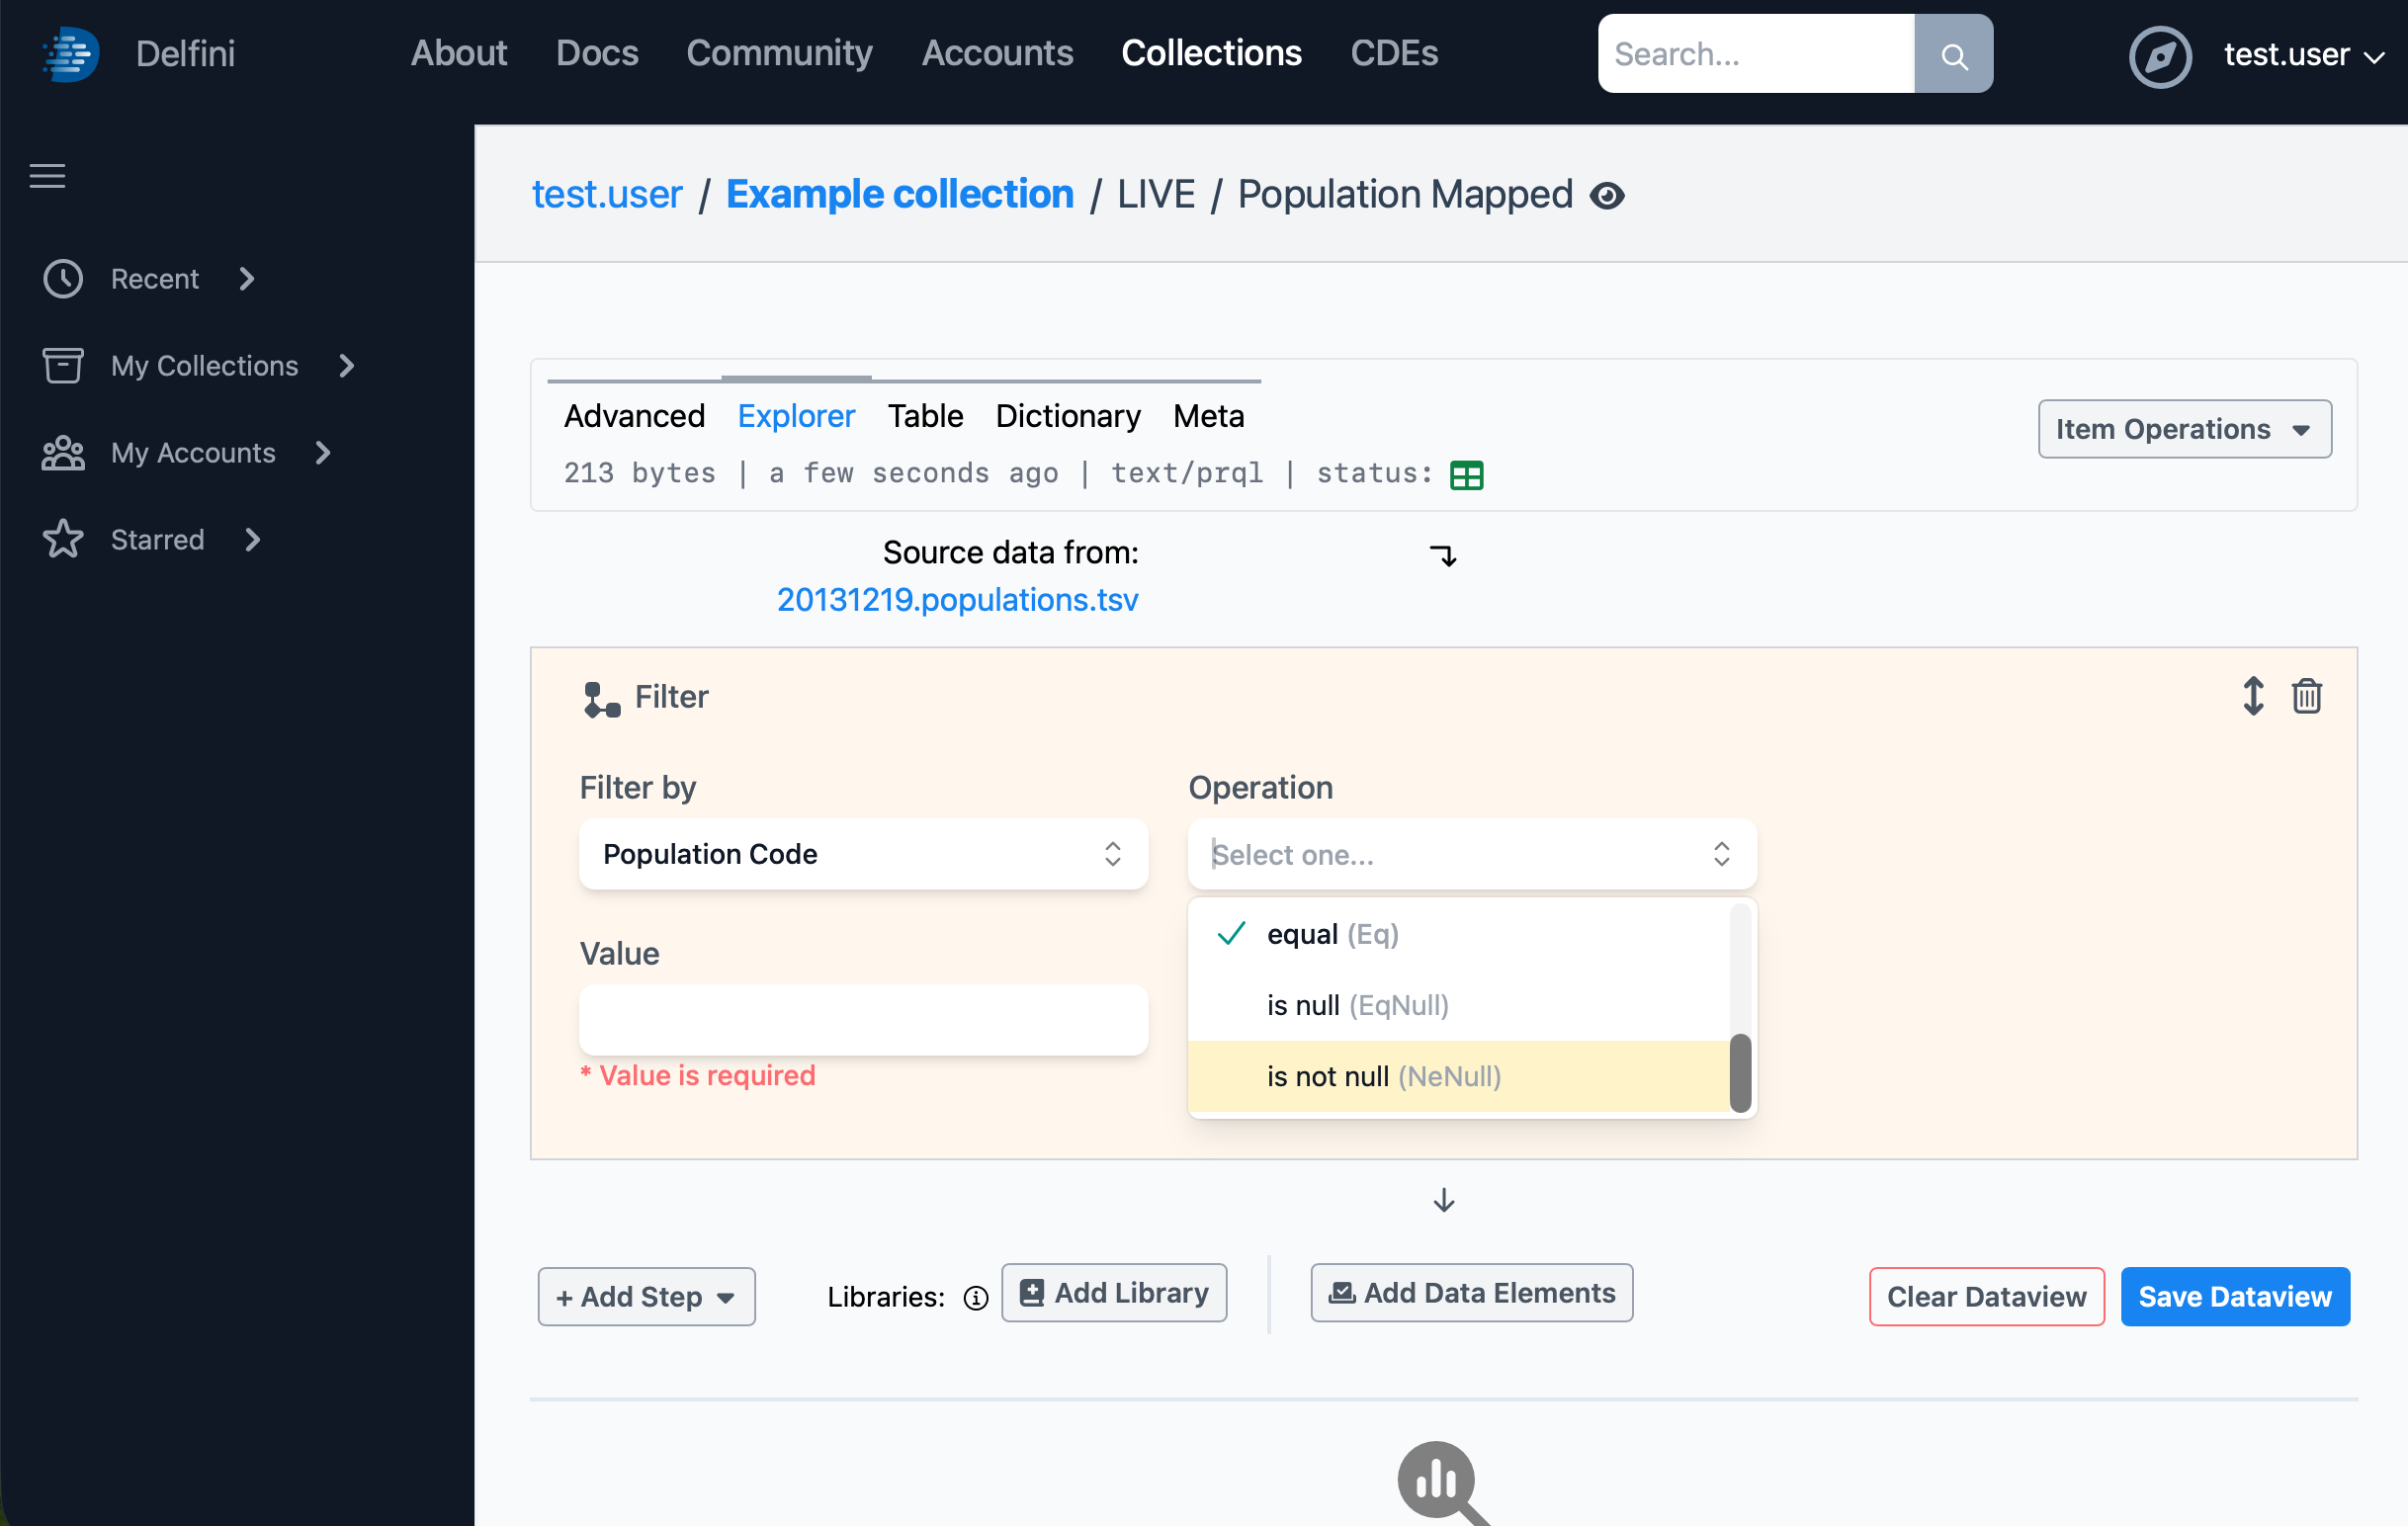
To begin building our dataview, we’ll filter out the unneeded rows. Click Add Step, then choose Filter Rows. The new step will appear. Choose to filter by Population Code, and set the operation to is not null.
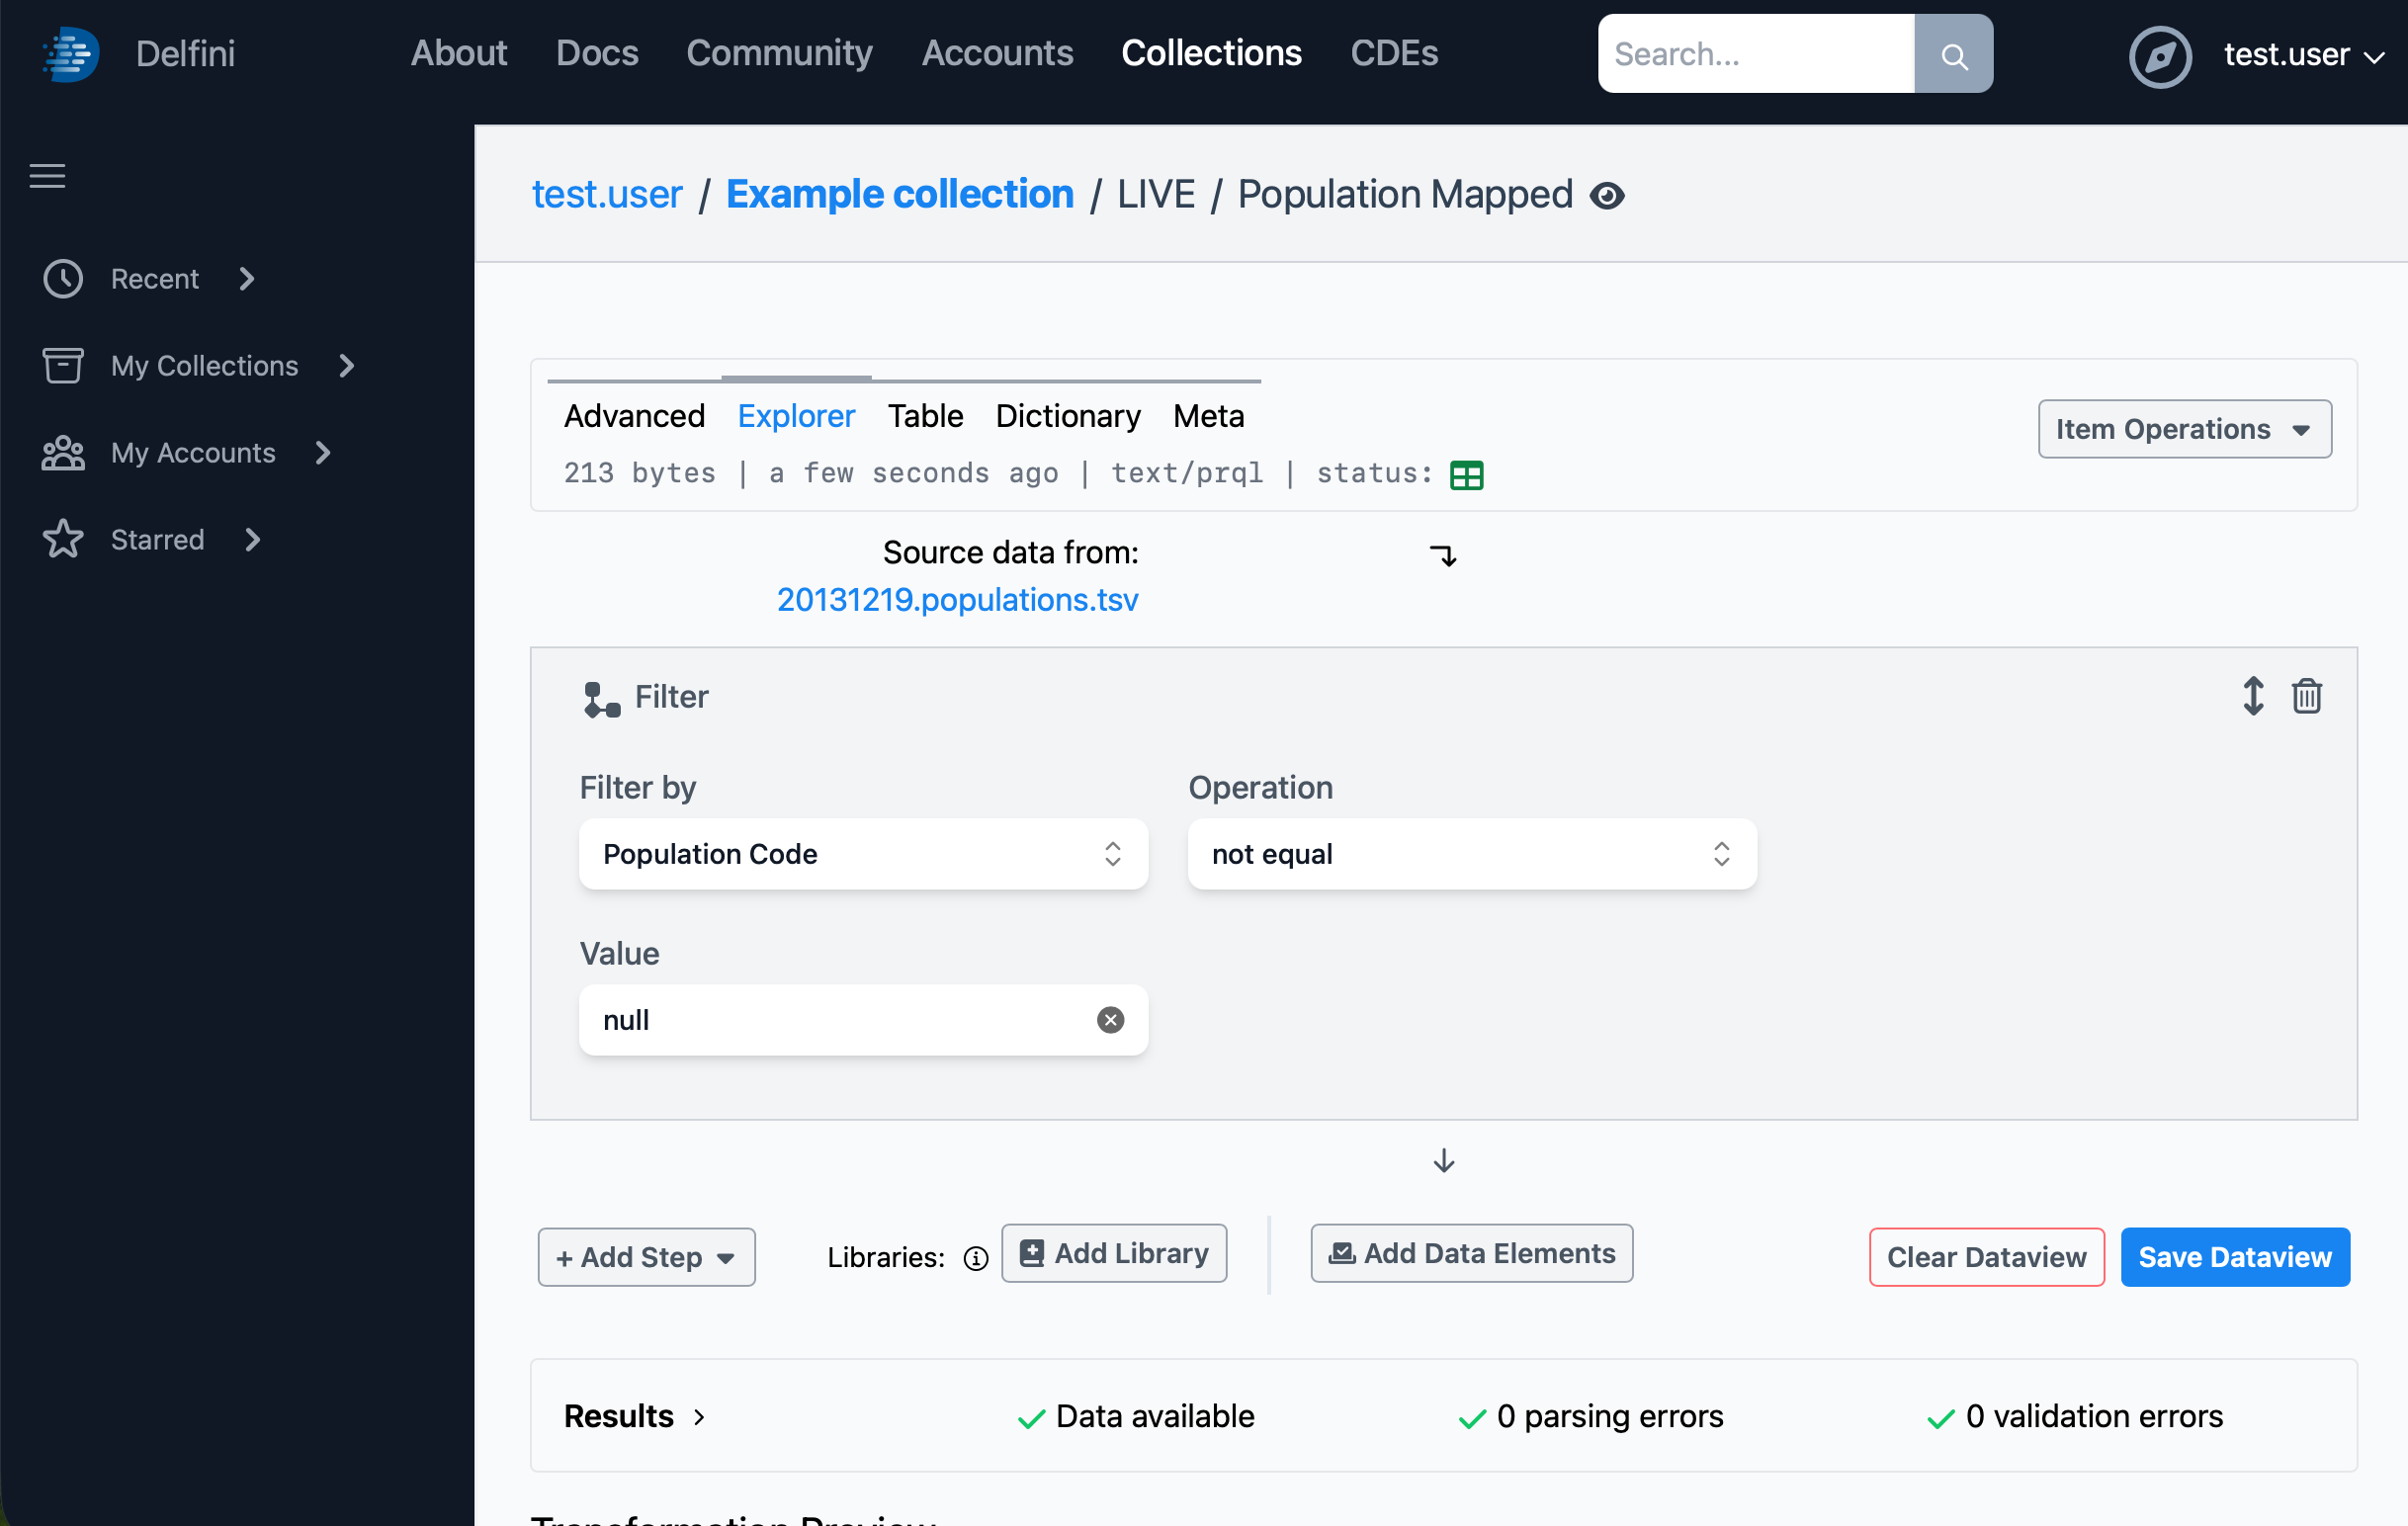
The dataview preview always only shows the first 25 rows of the result. Since the rows we wanted to filter out are past that point (at the very end of the data table), we won’t be able to see the change in the preview, but if you’d like, feel free to click Save Dataview now and then click the Table tab at the top to see the full results.
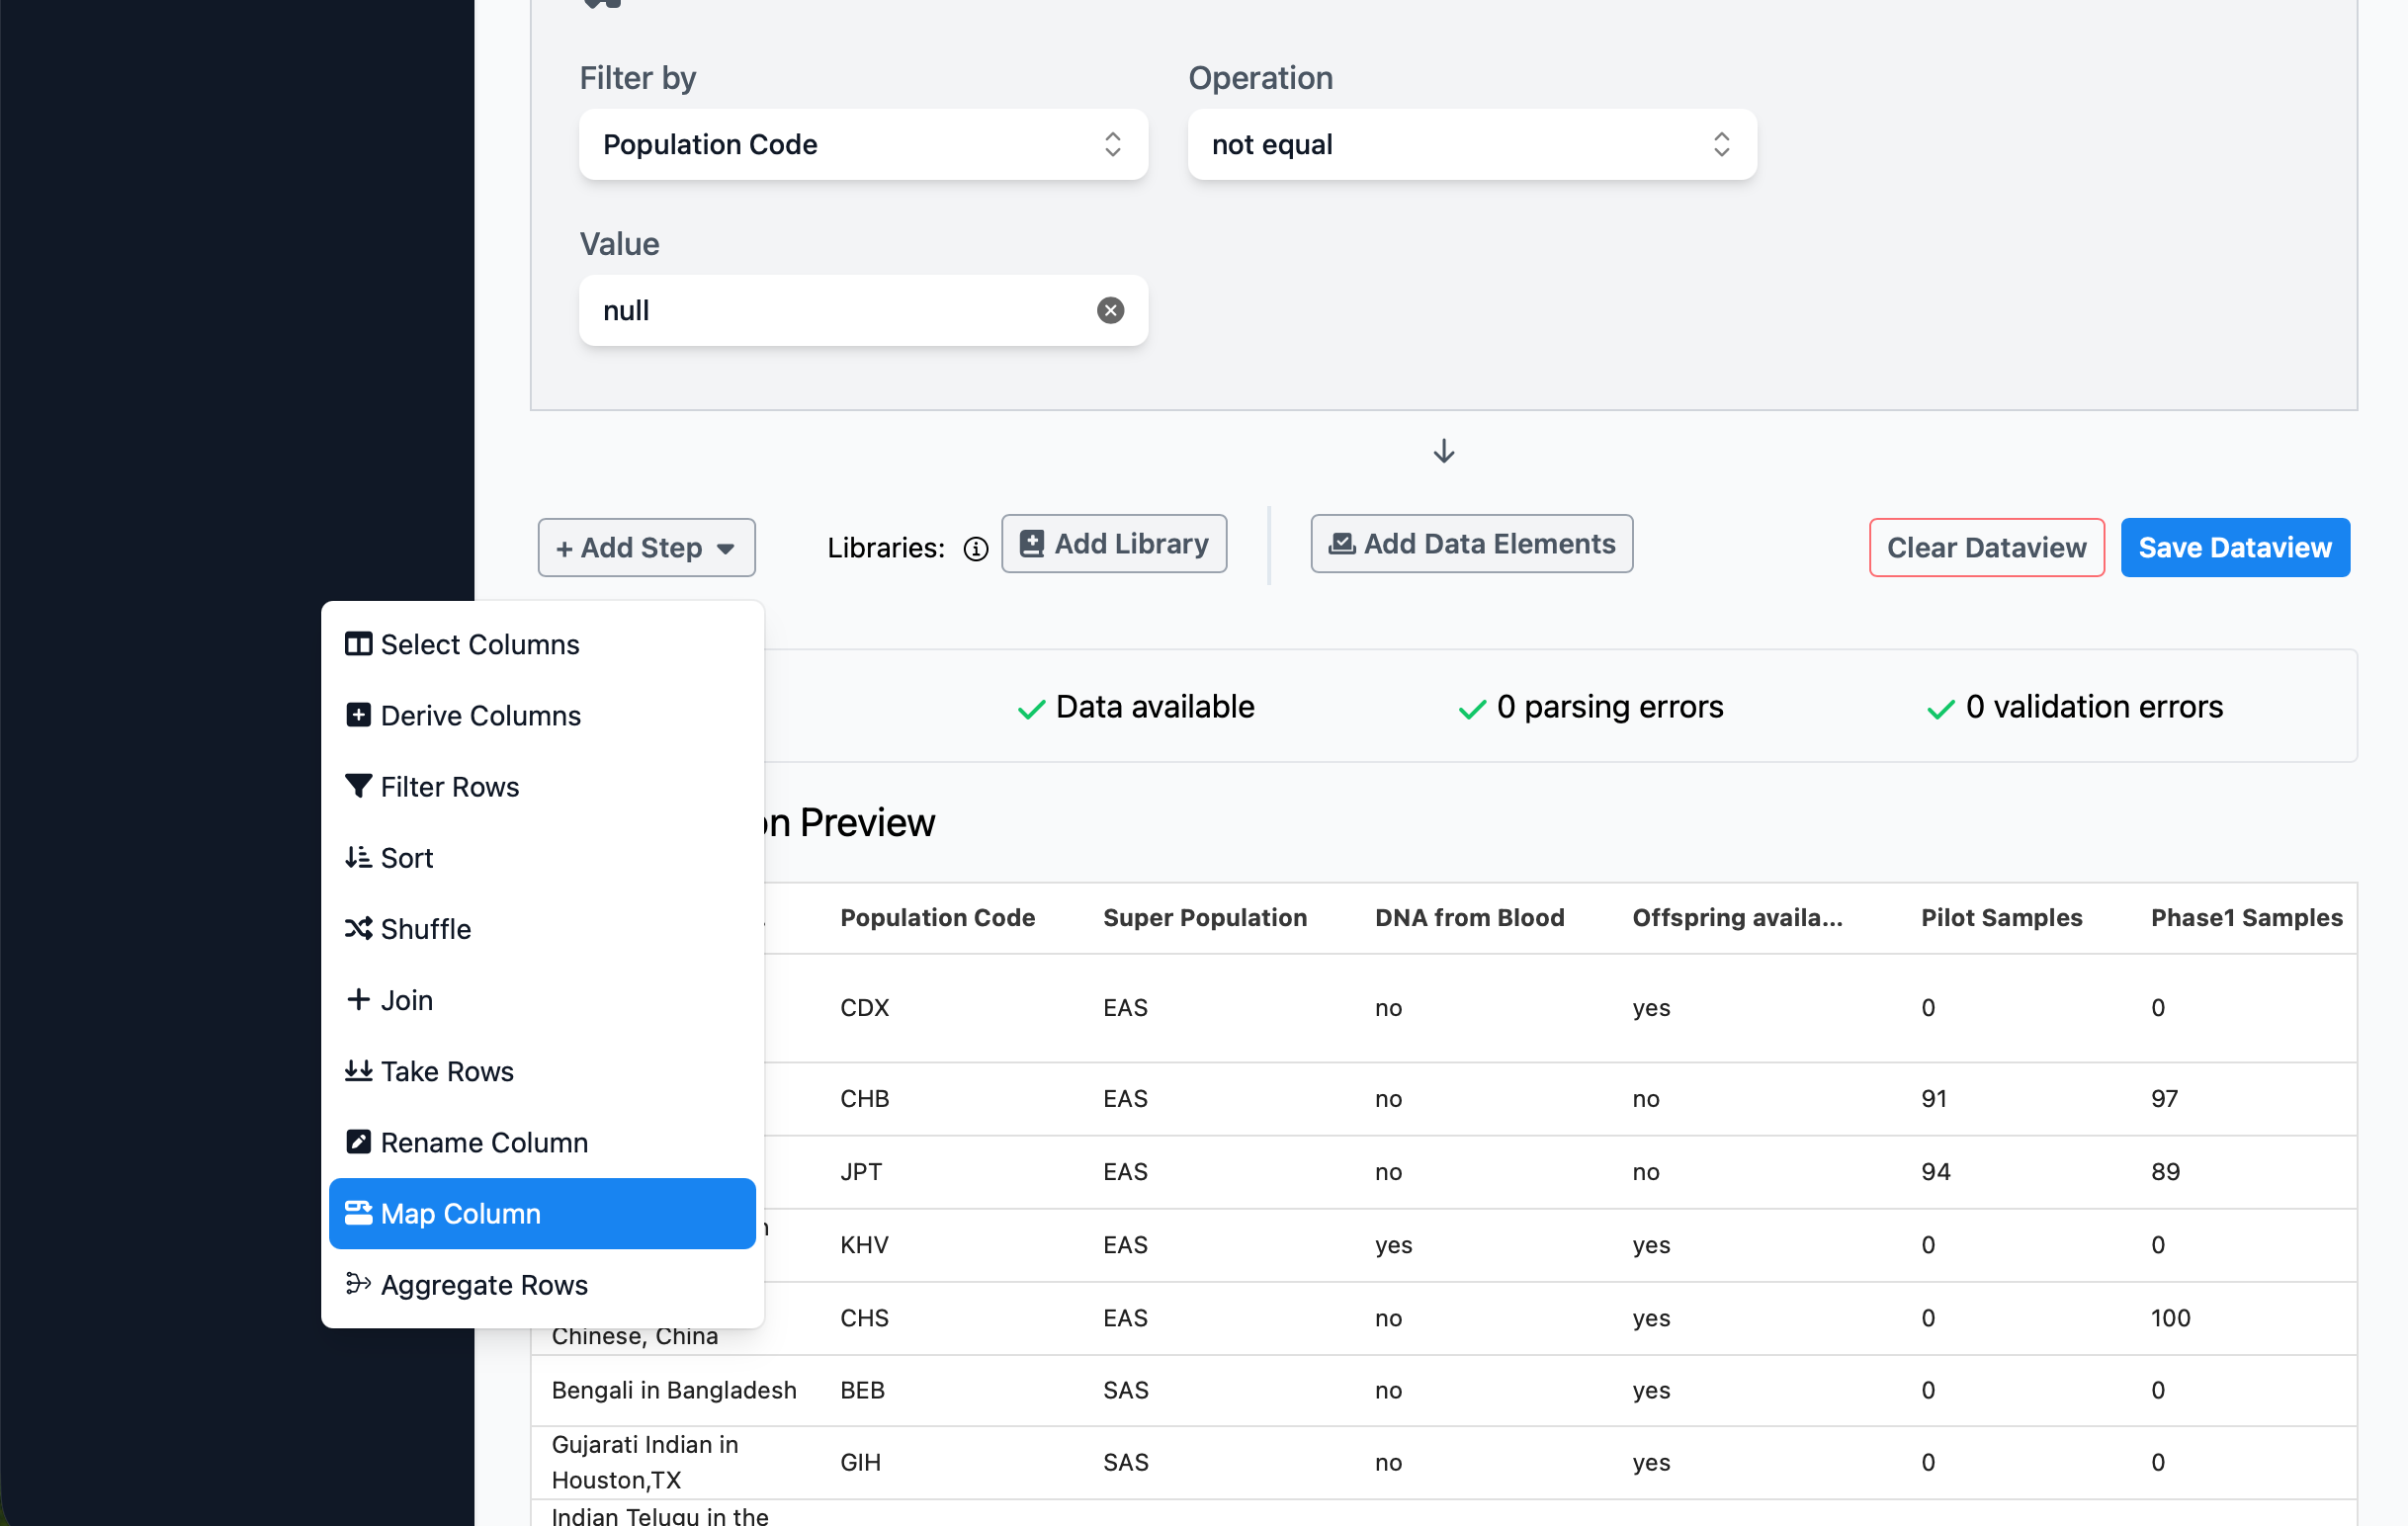
The second operation we’d like to perform is mapping the Super Population code to a readable value. To do this, click Add Step again, and choose Map Column.
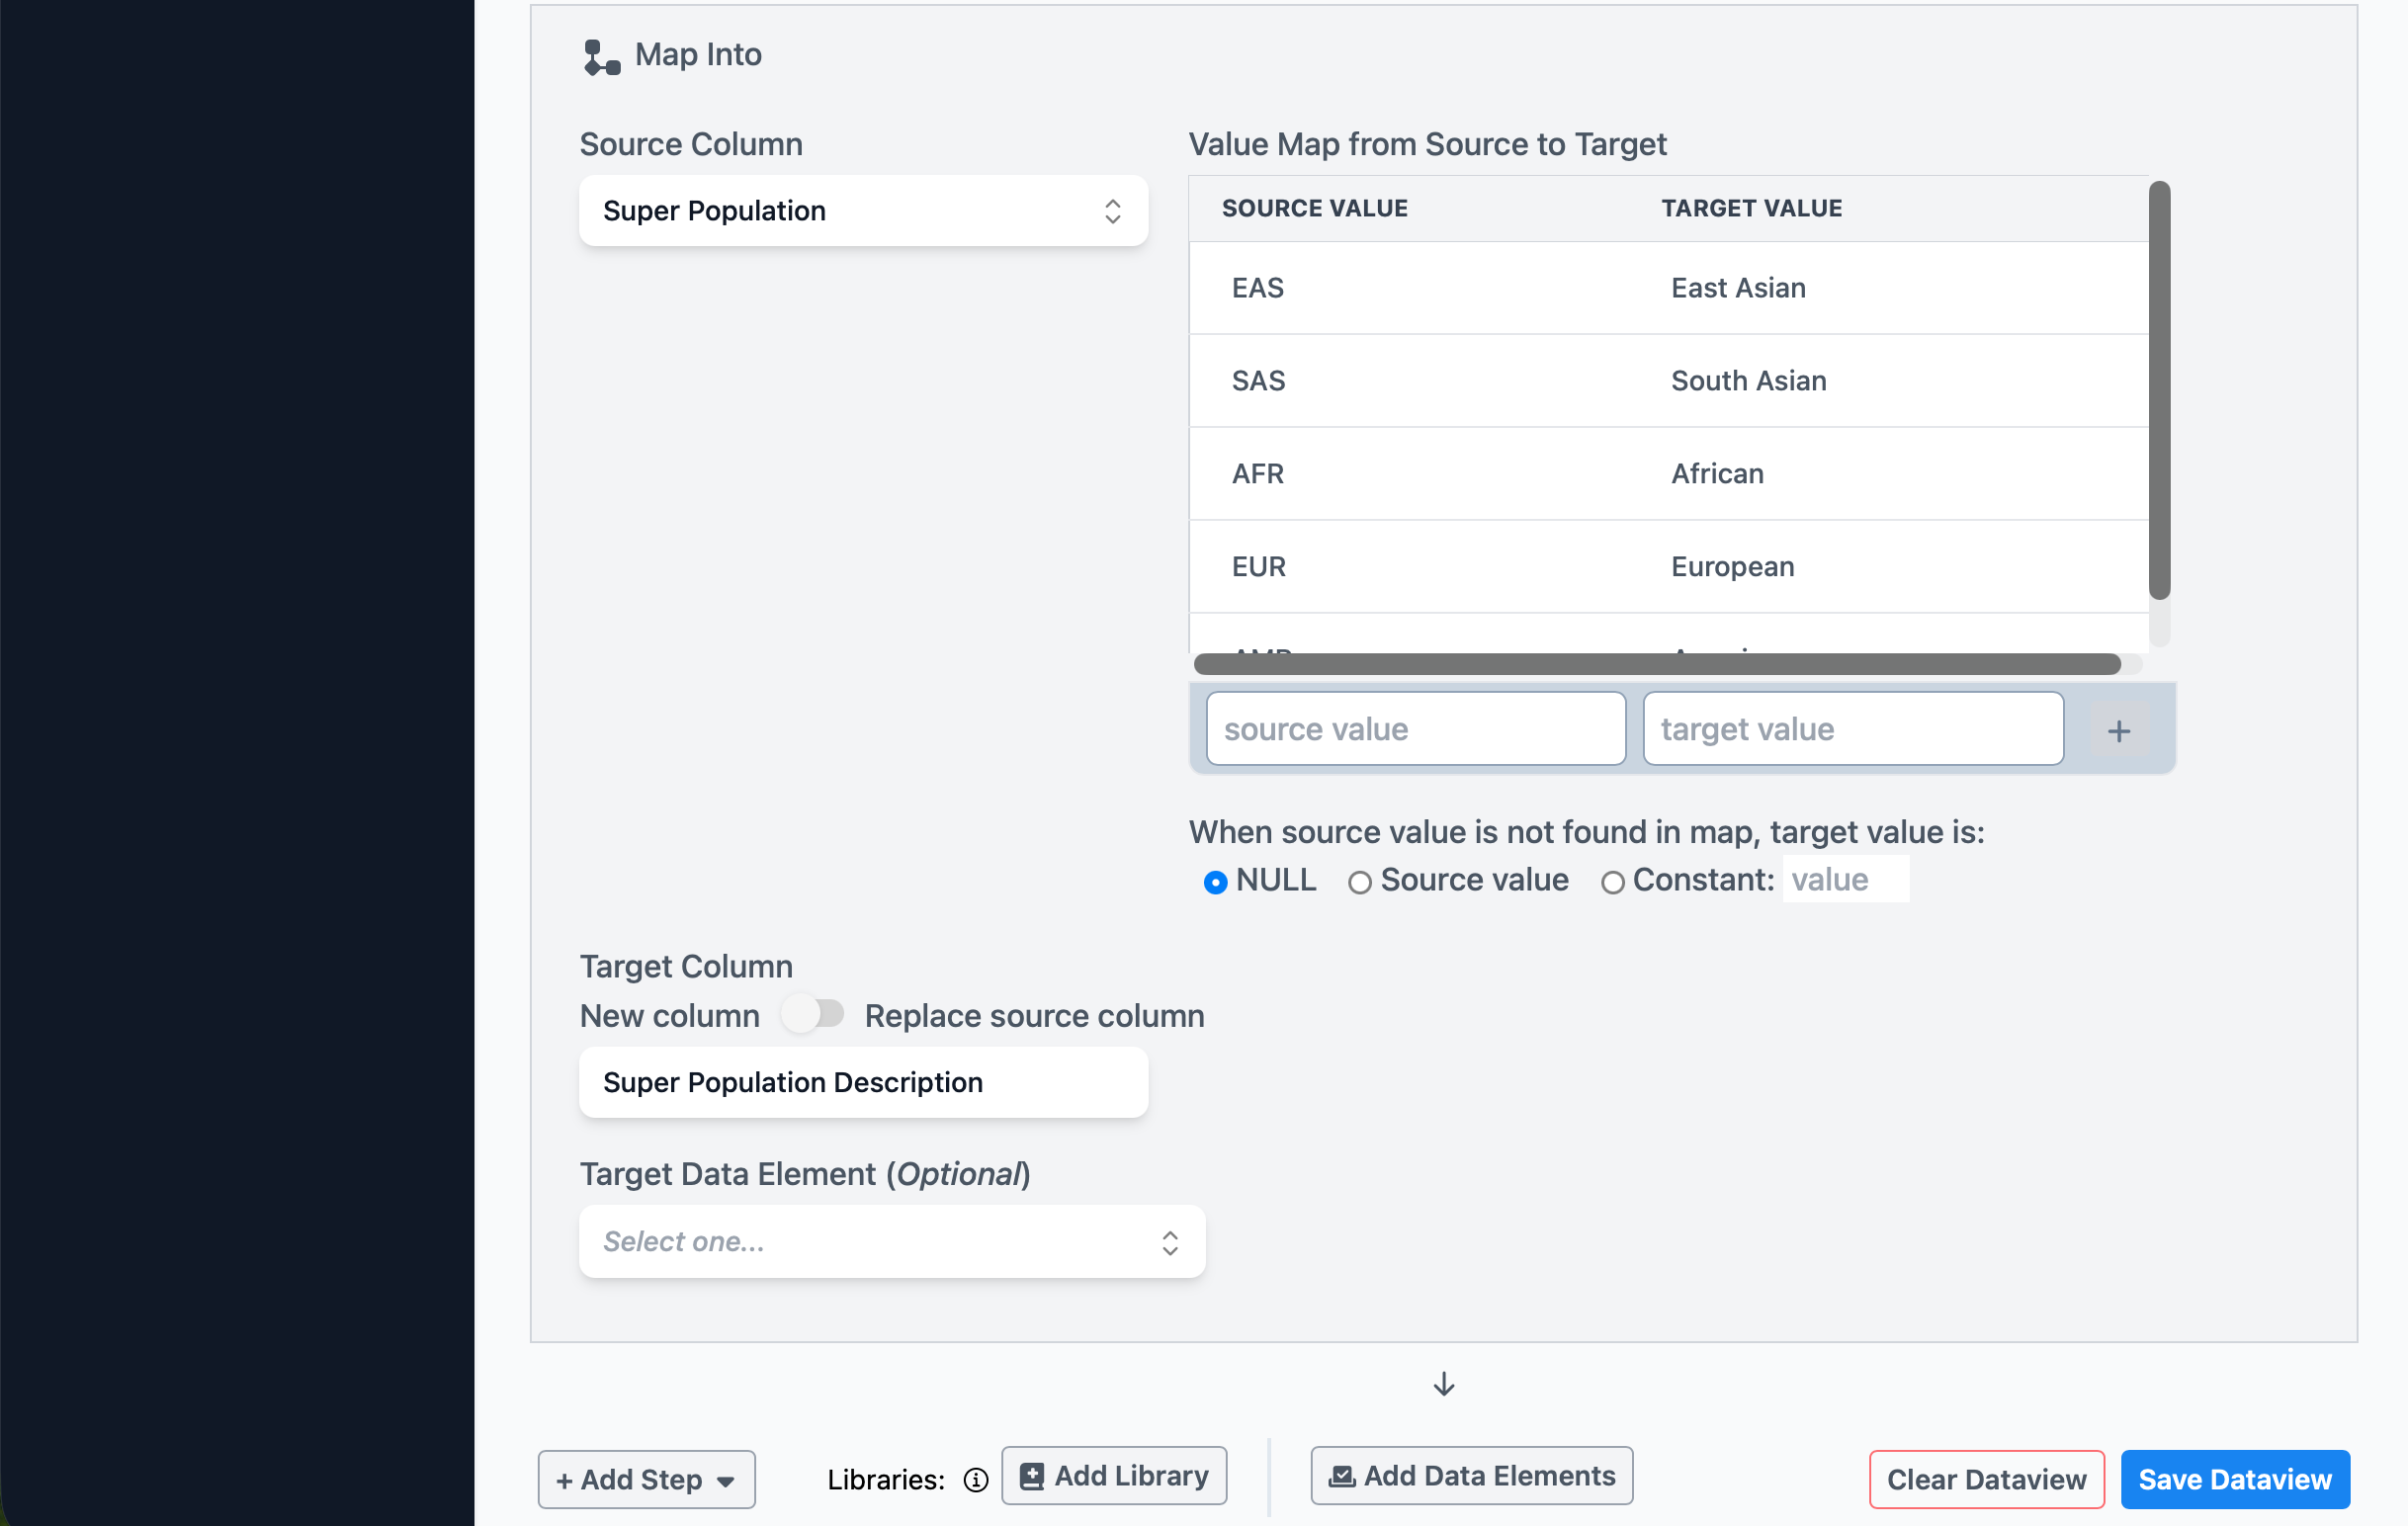
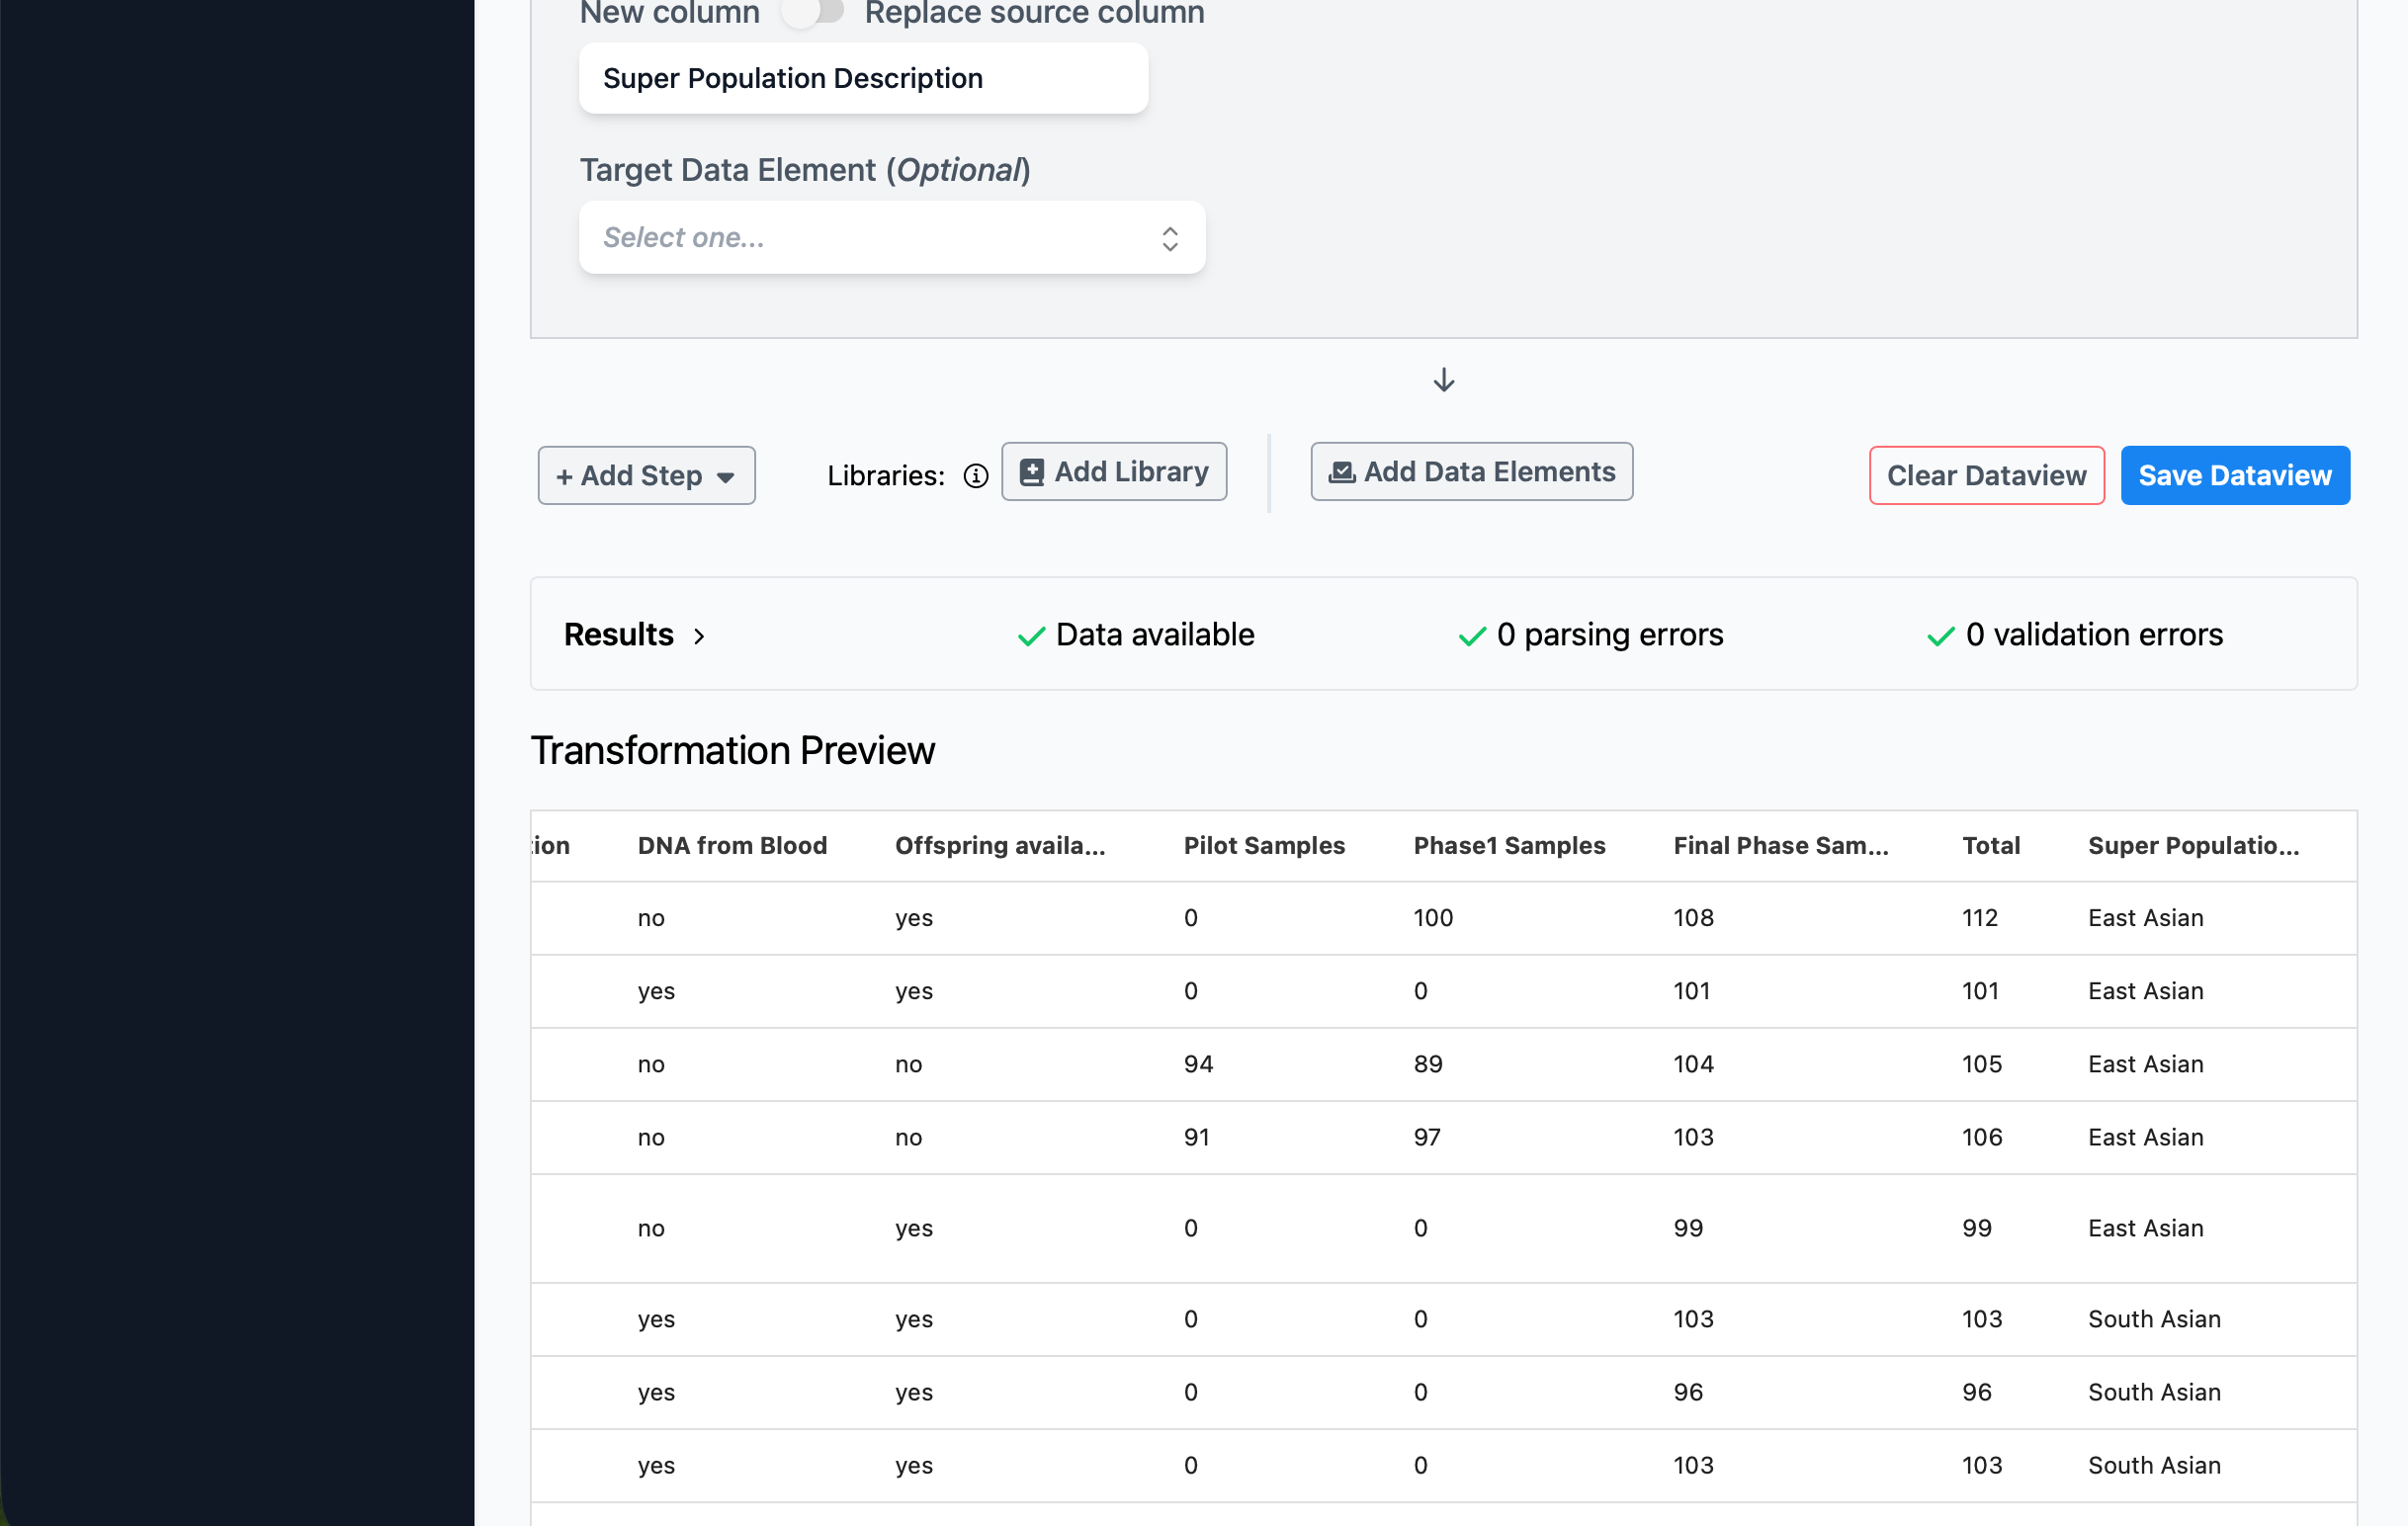
To configure the new step, choose Super Population as the Source Column, toggle to select the target column as a New column, and enter the new label as Super Population Description. Finally, configure the value map by entering the following source and target values, clicking the + button after each:
| Source value | Target value |
|---|---|
| EAS | East Asian |
| SAS | South Asian |
| AFR | African |
| EUR | European |
| AMR | American |
You should now see that the dataview shows the new column, if you scroll down and scroll the preview to show the rightmost column. By default, new columns are added to the right of existing columns.
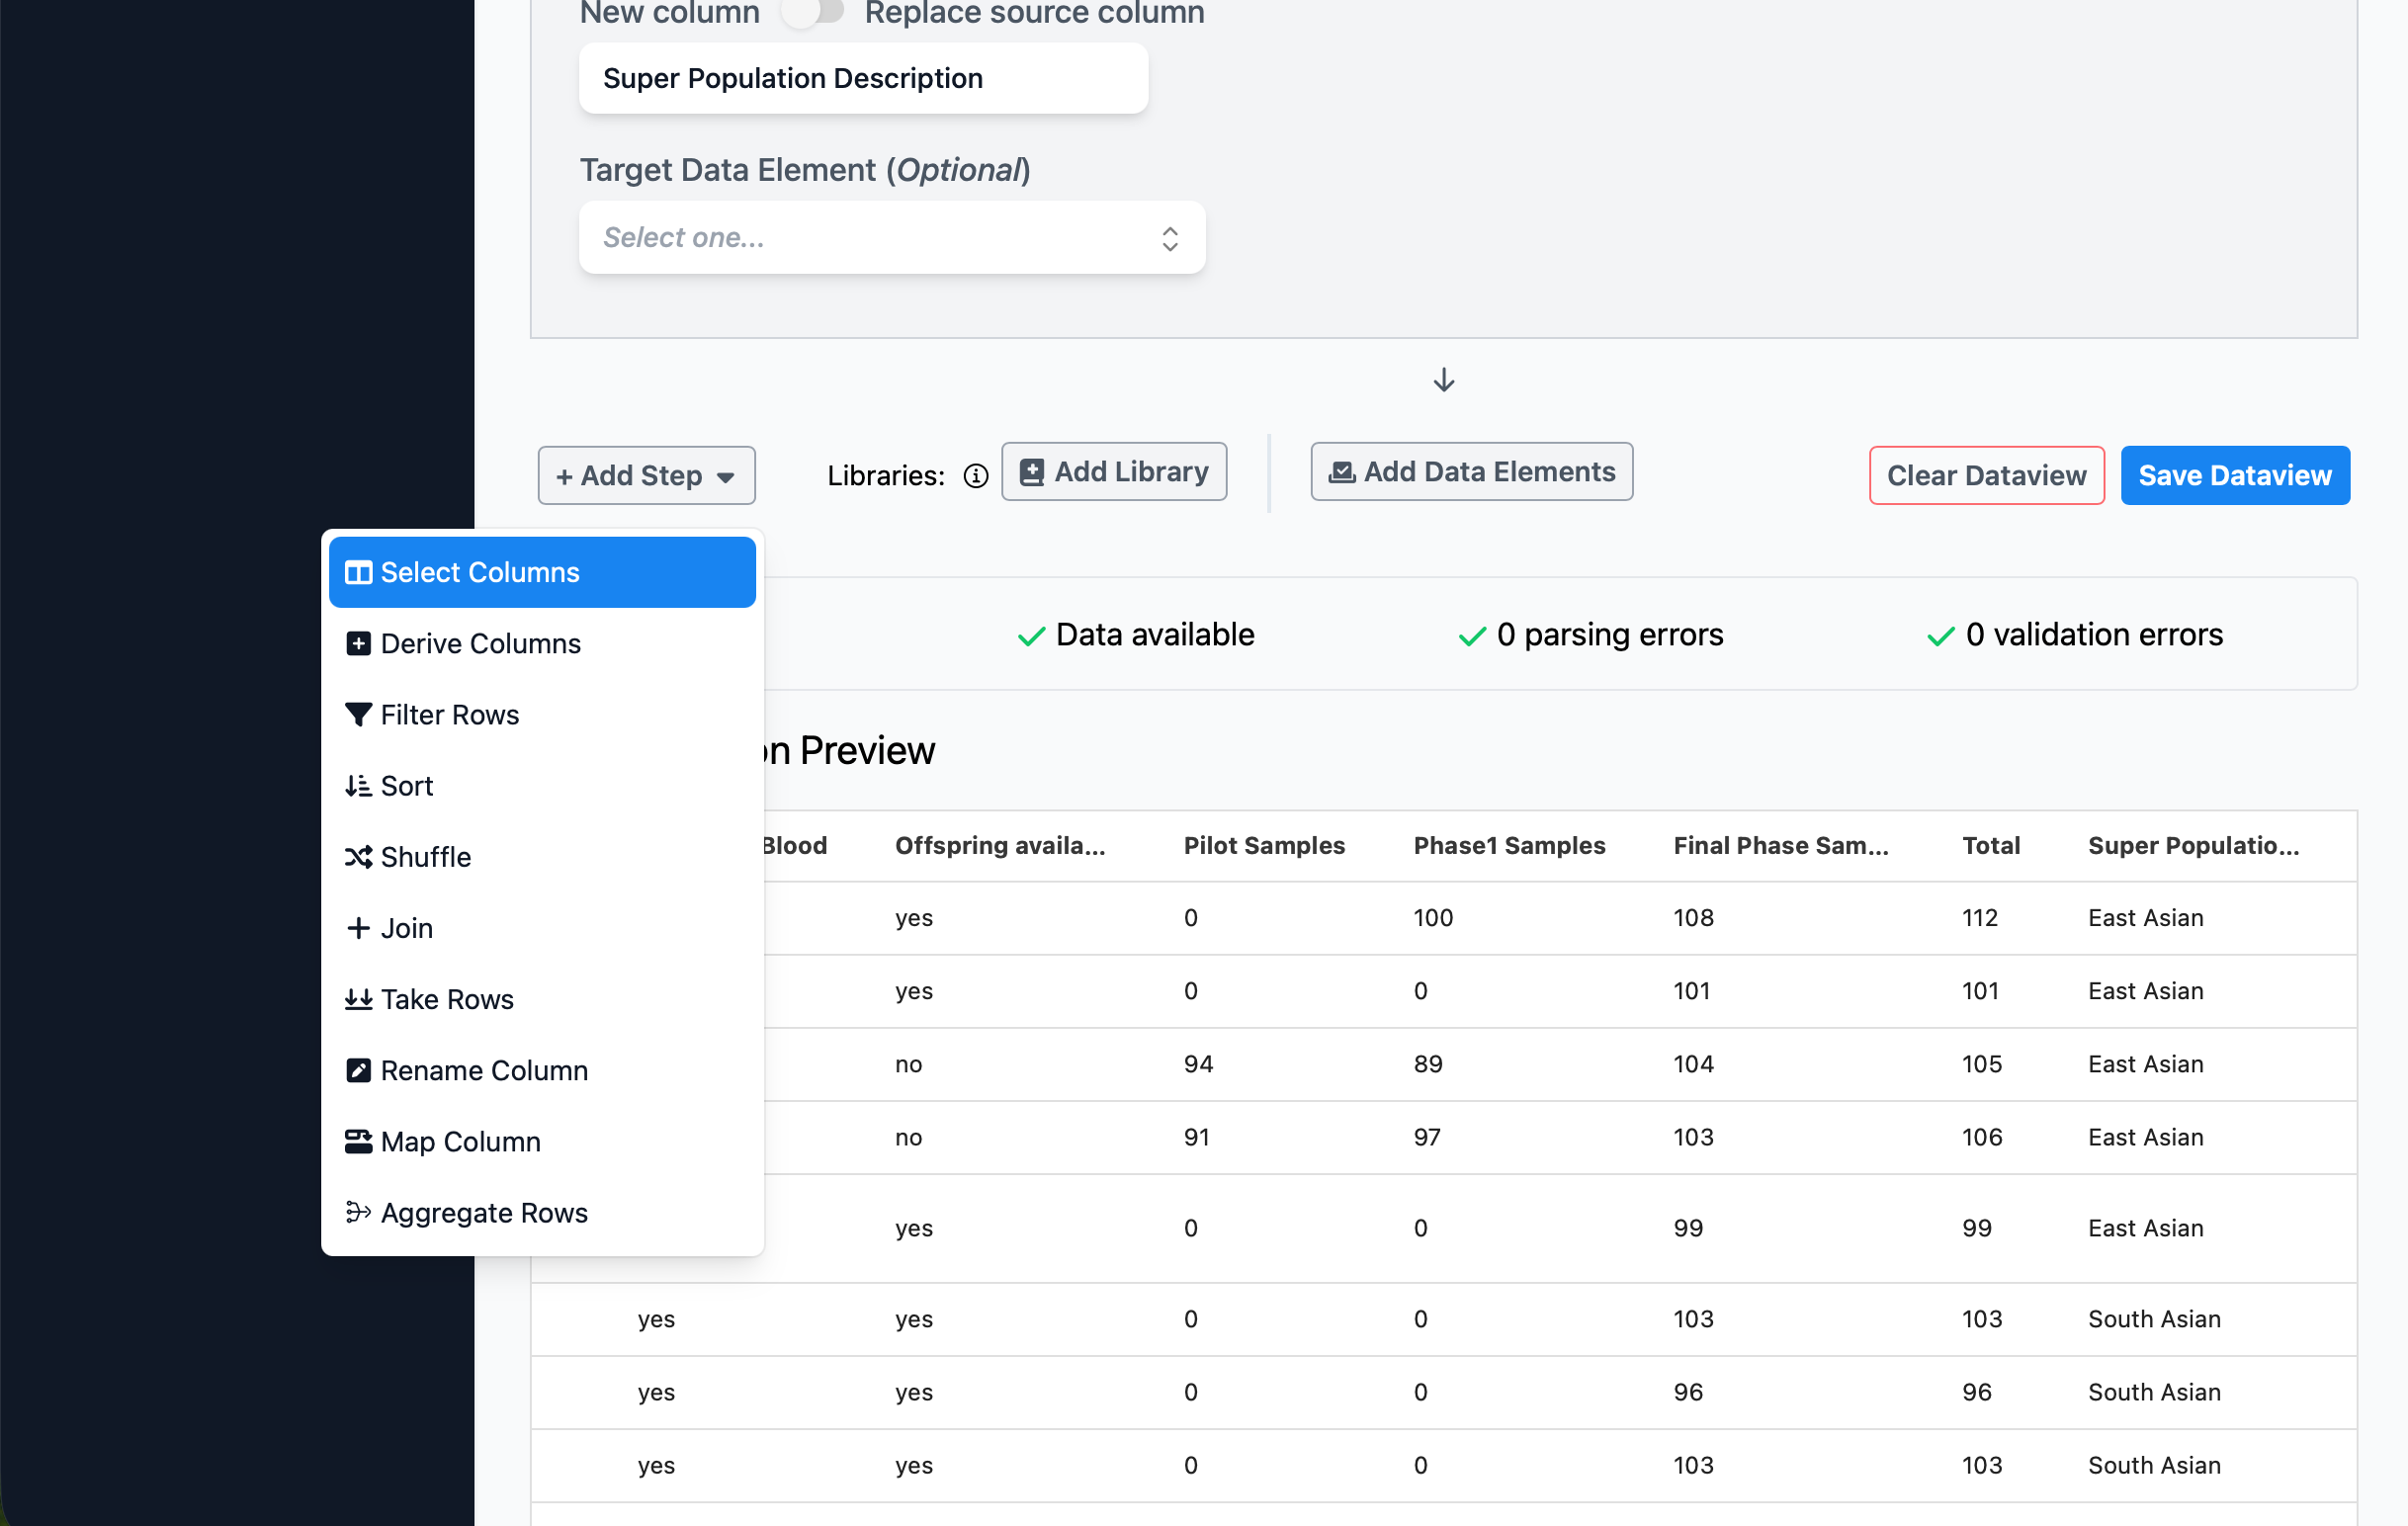
However, it’ll be easier to use this data if we re-order the columns so that the description is adjacent to the existing code. We can do this by adding a Select Columns step. This step will allow us both to choose which columns we want in the output, as well as drag-and-drop to change their order.
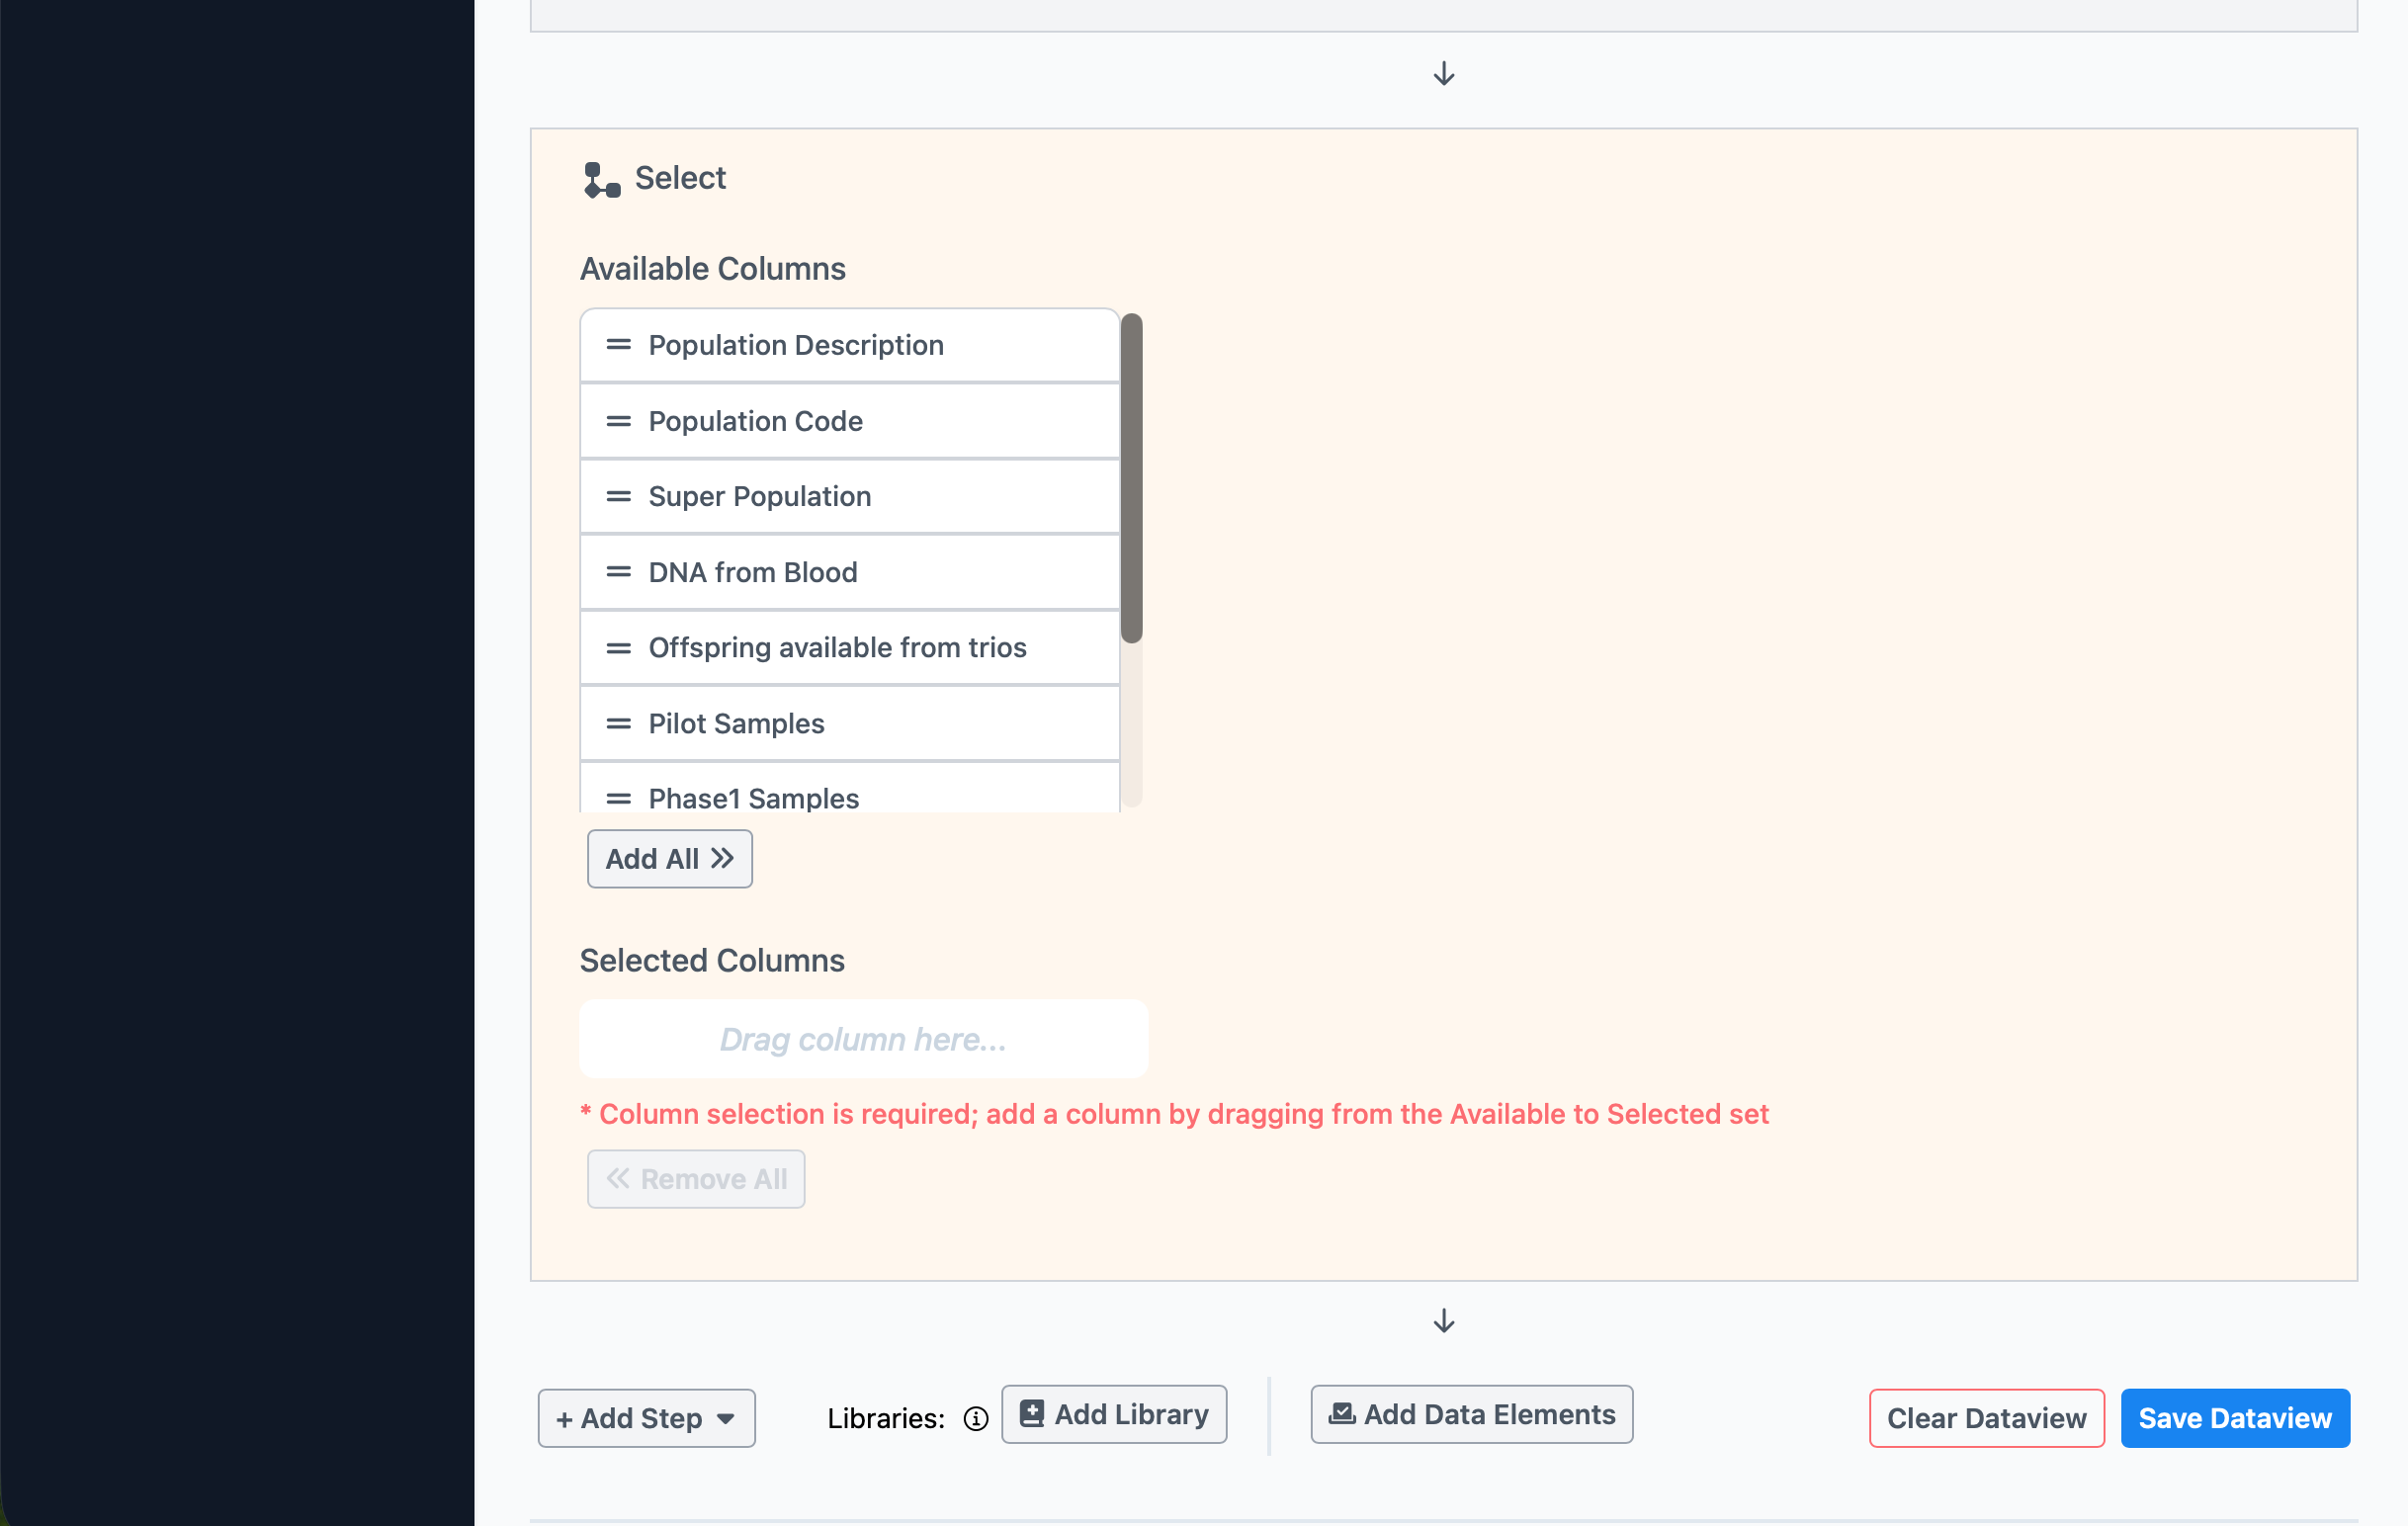
Click Add Step, then choose Select Columns. Click the Add All button, then in the Selected Columns set, scroll to the bottom, and grab the two-lines (=) handle to drag it upwards and drop it next to the existing Super Population column.
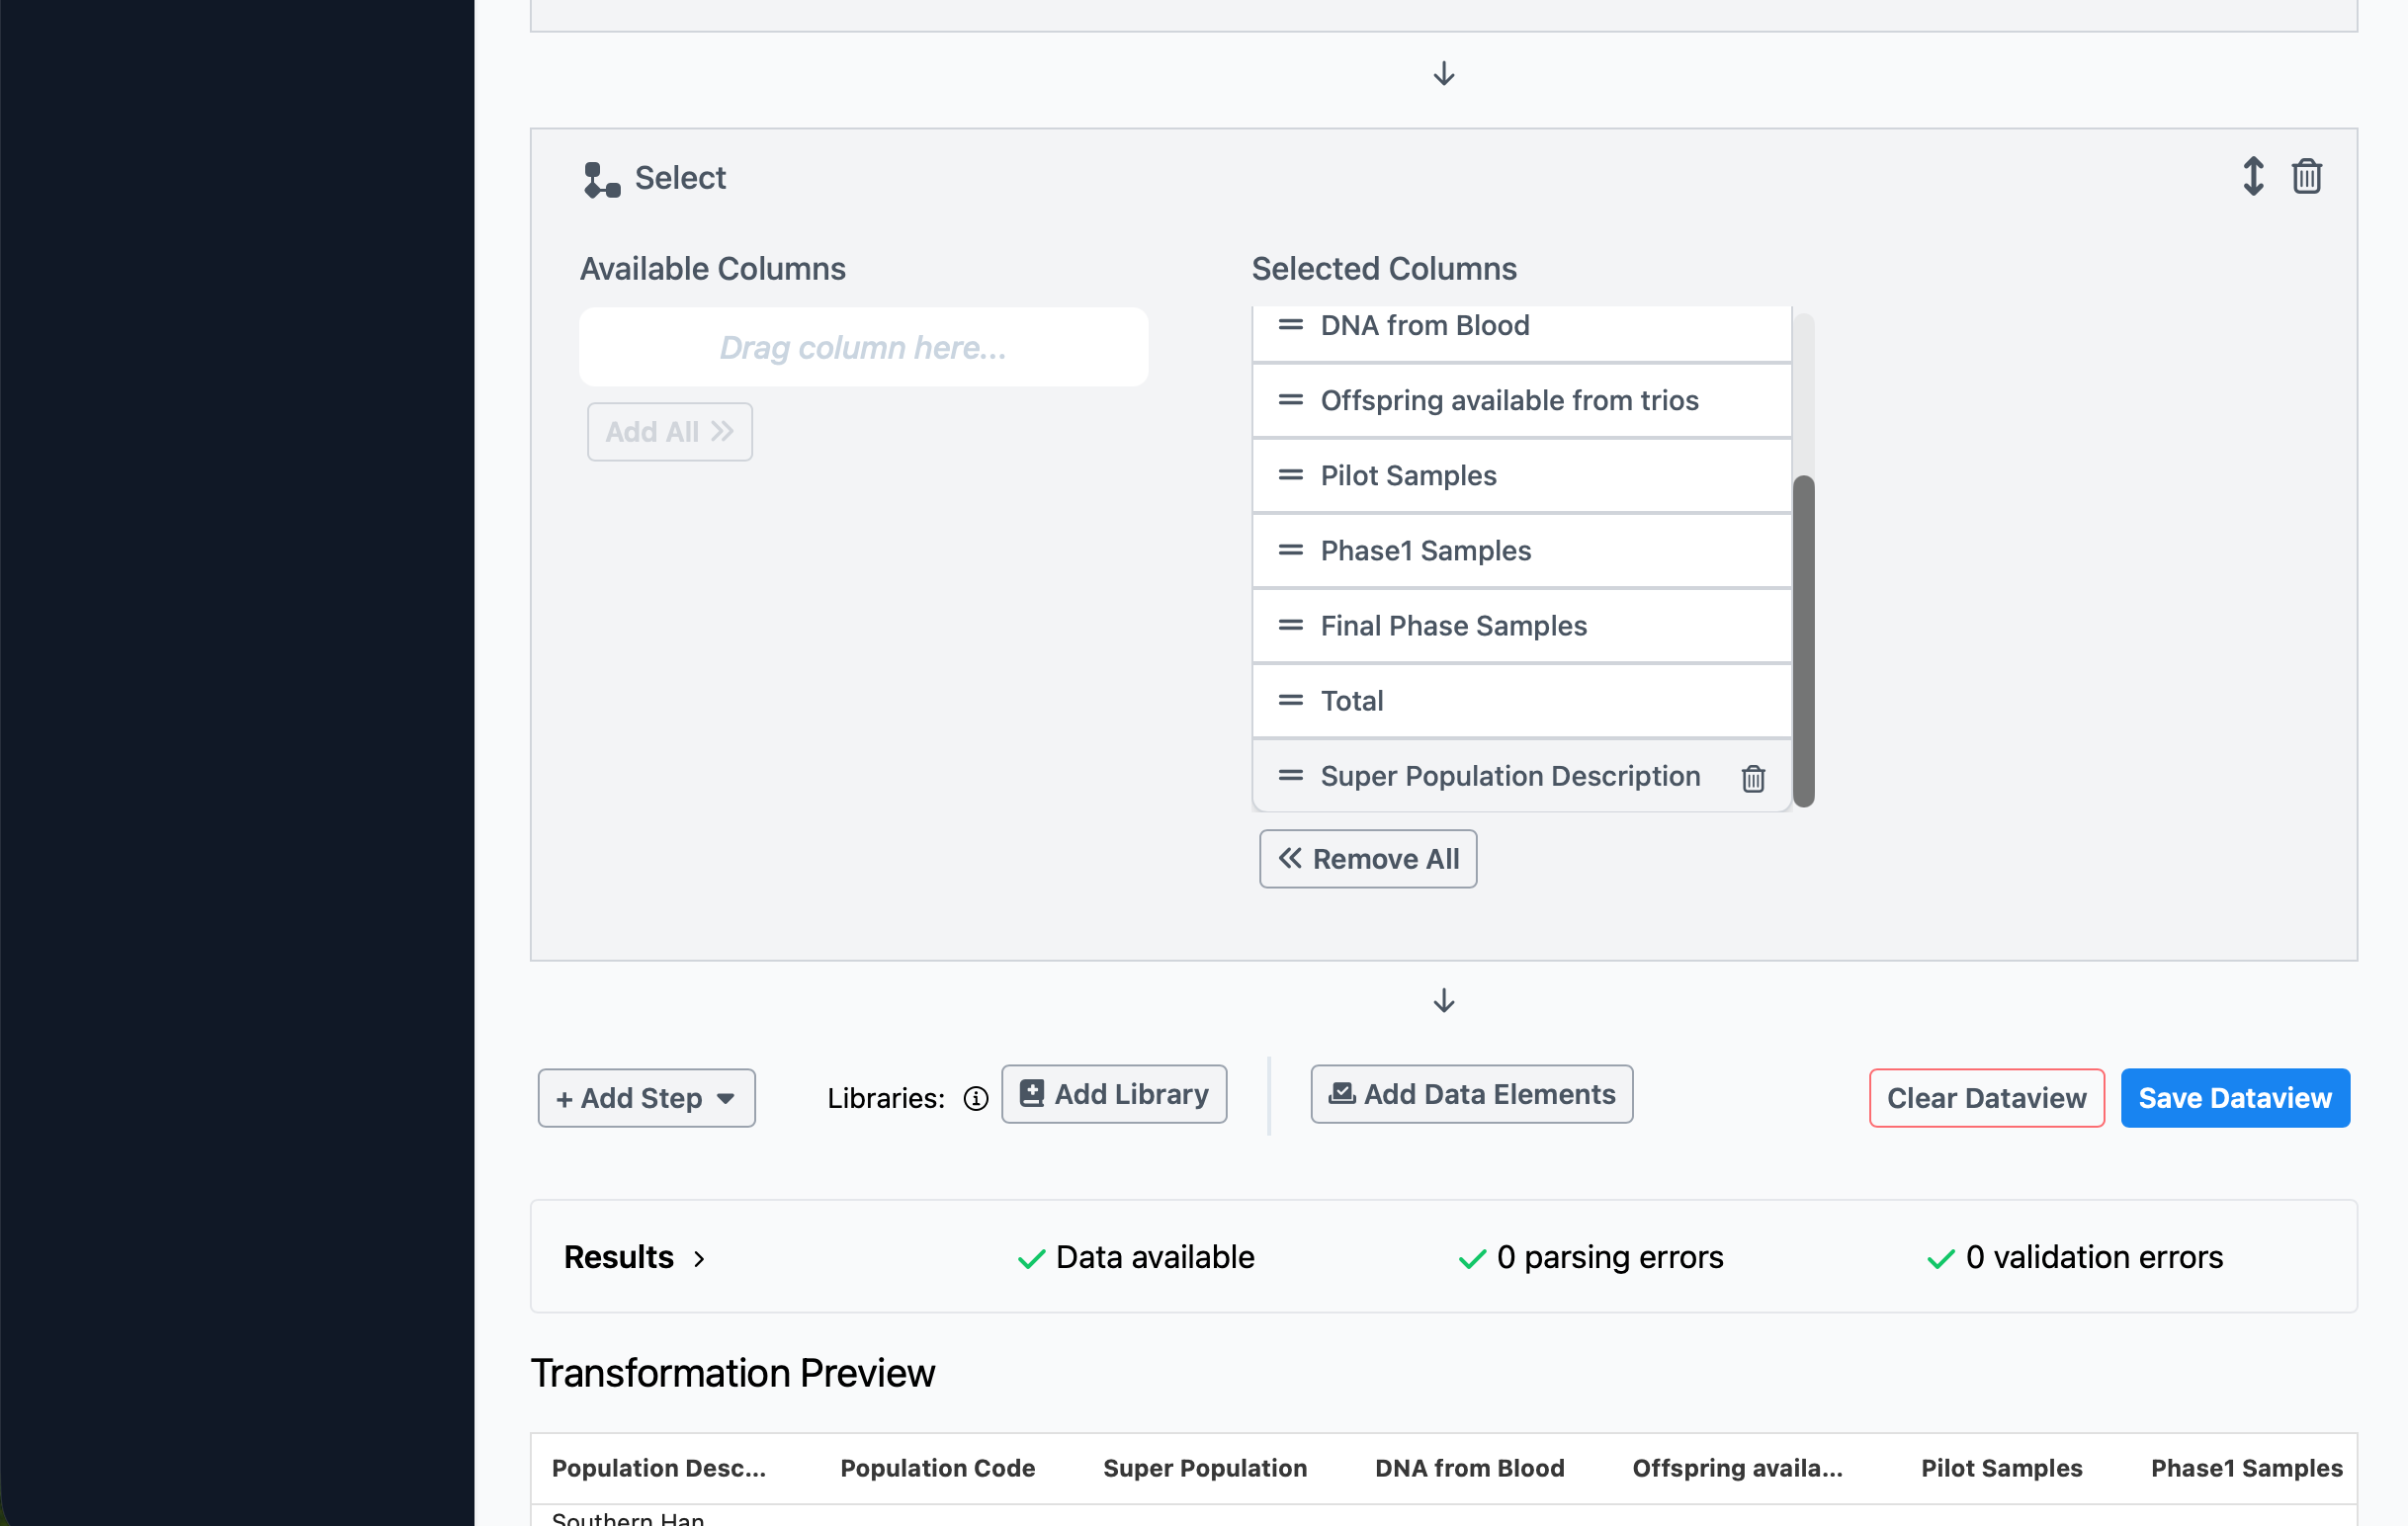
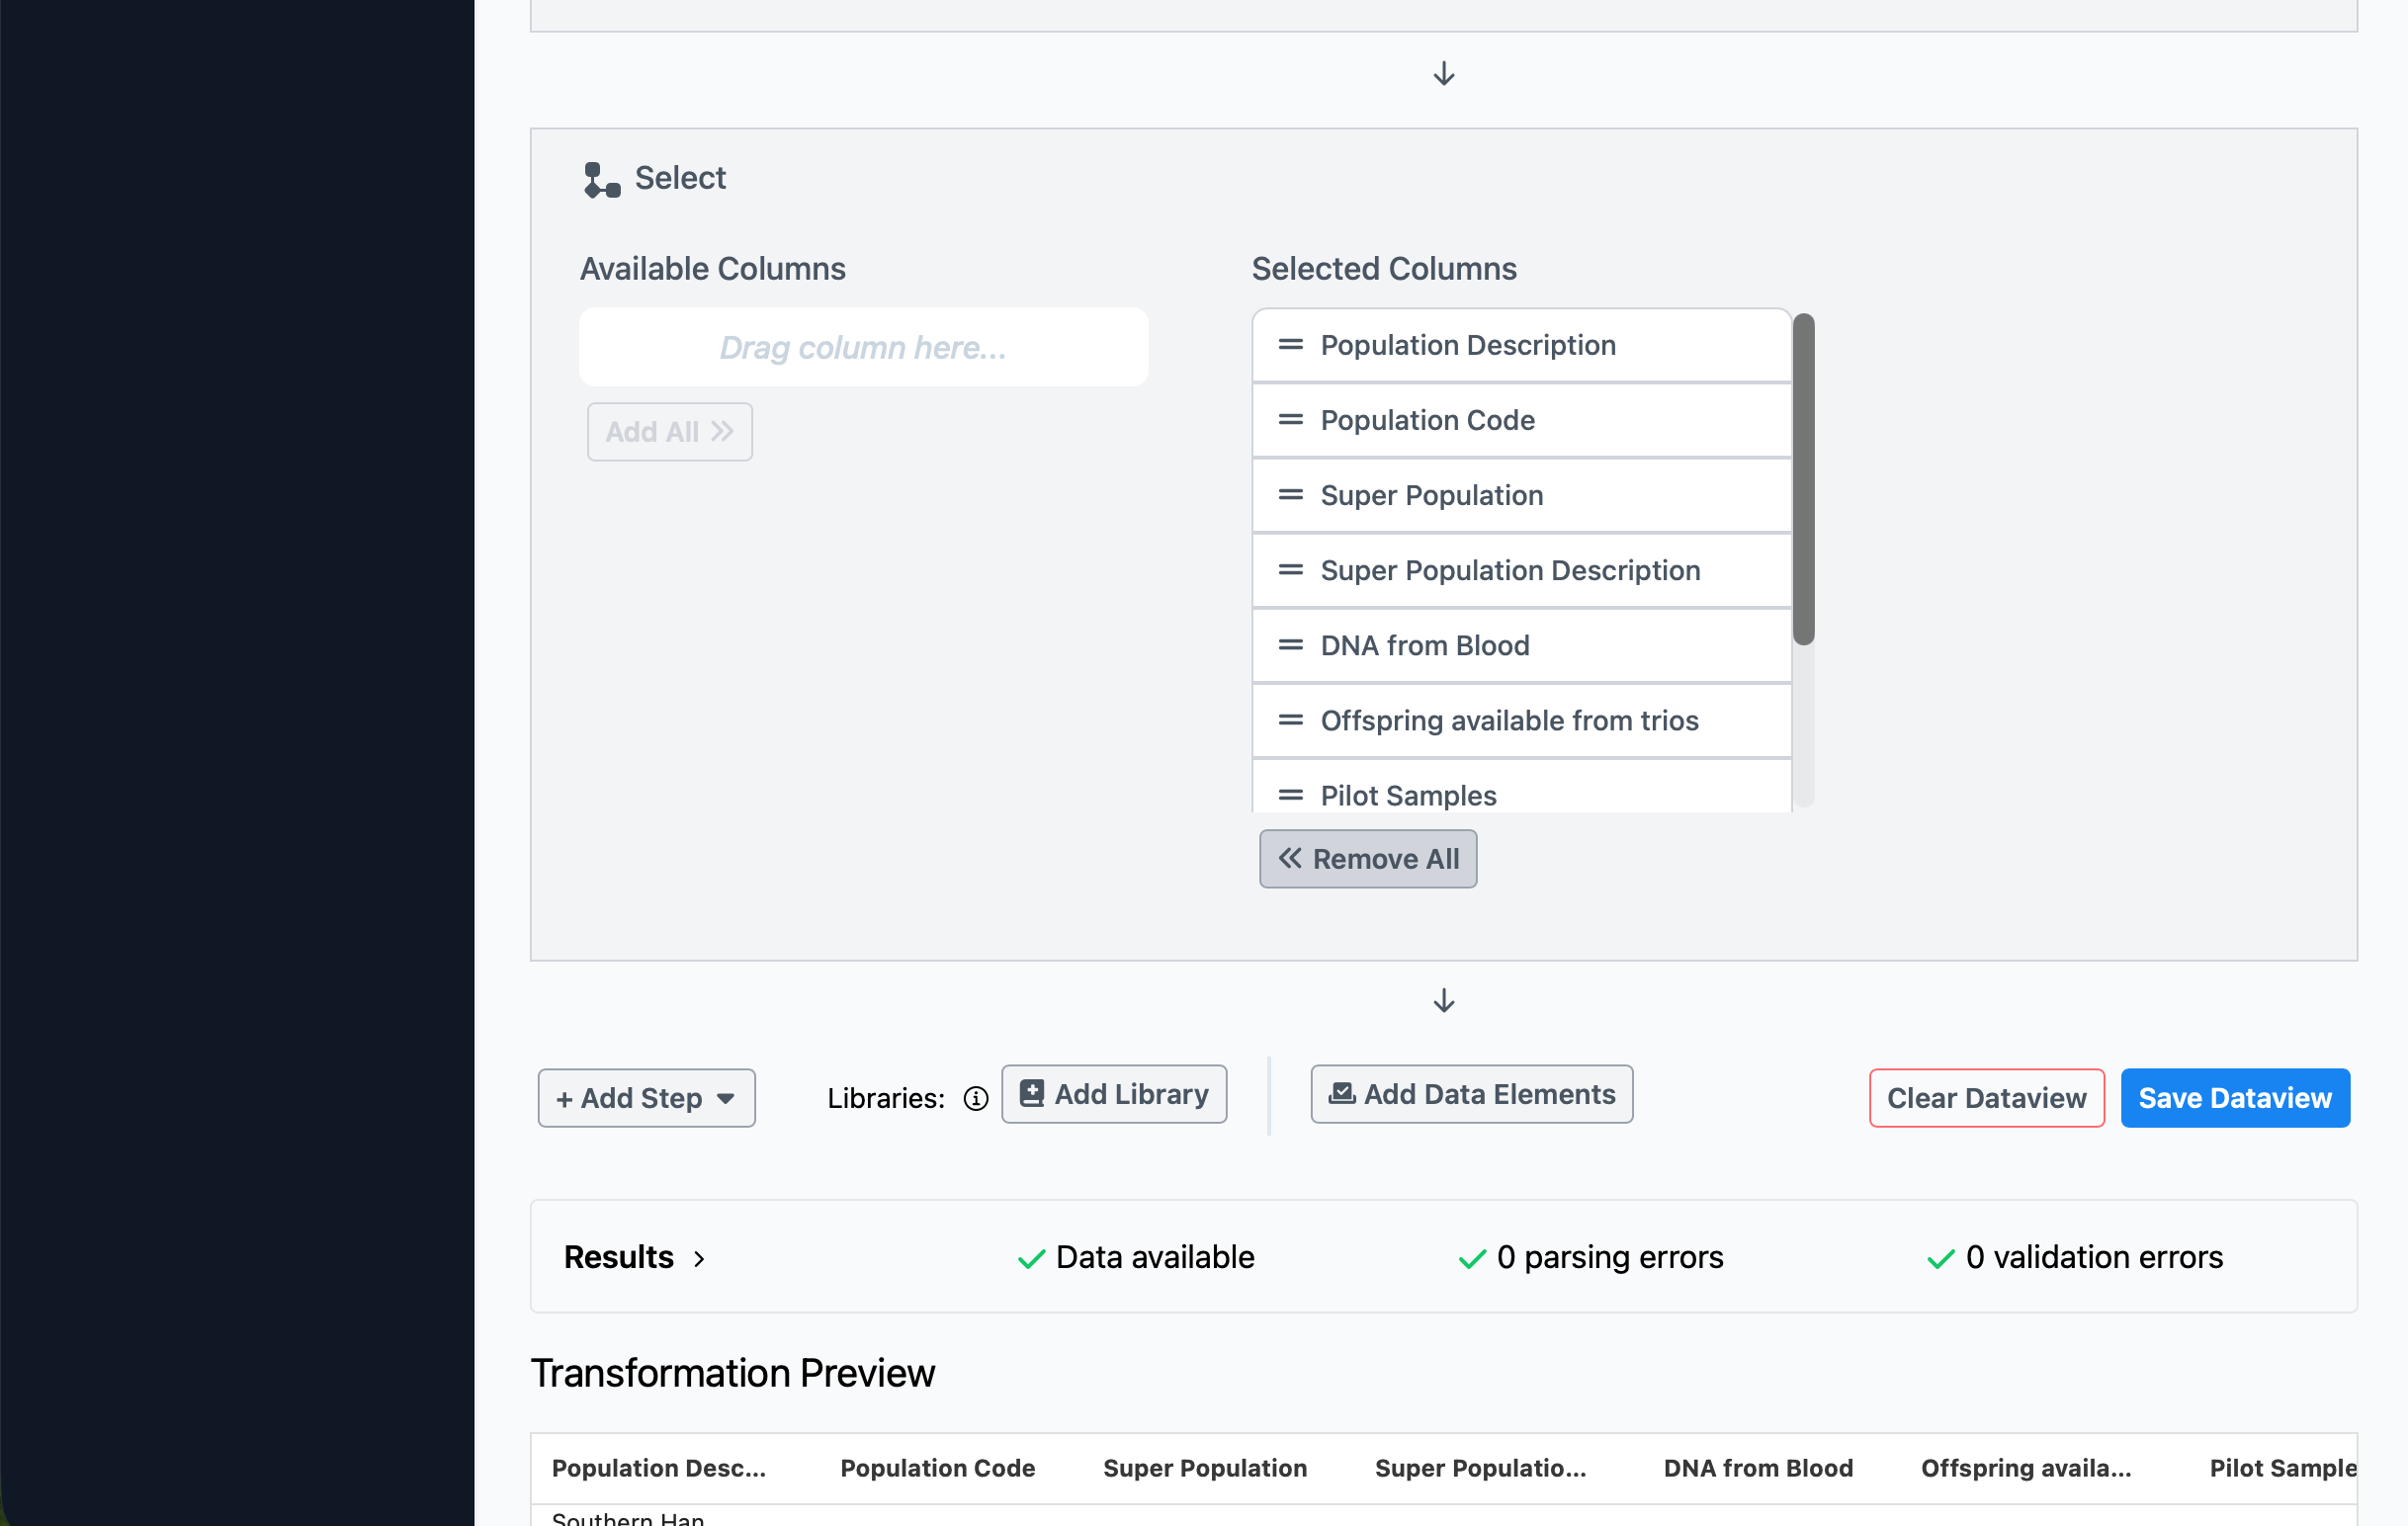
Now when you scroll down to see the dataview preview, you’ll see the columns in the desired order.
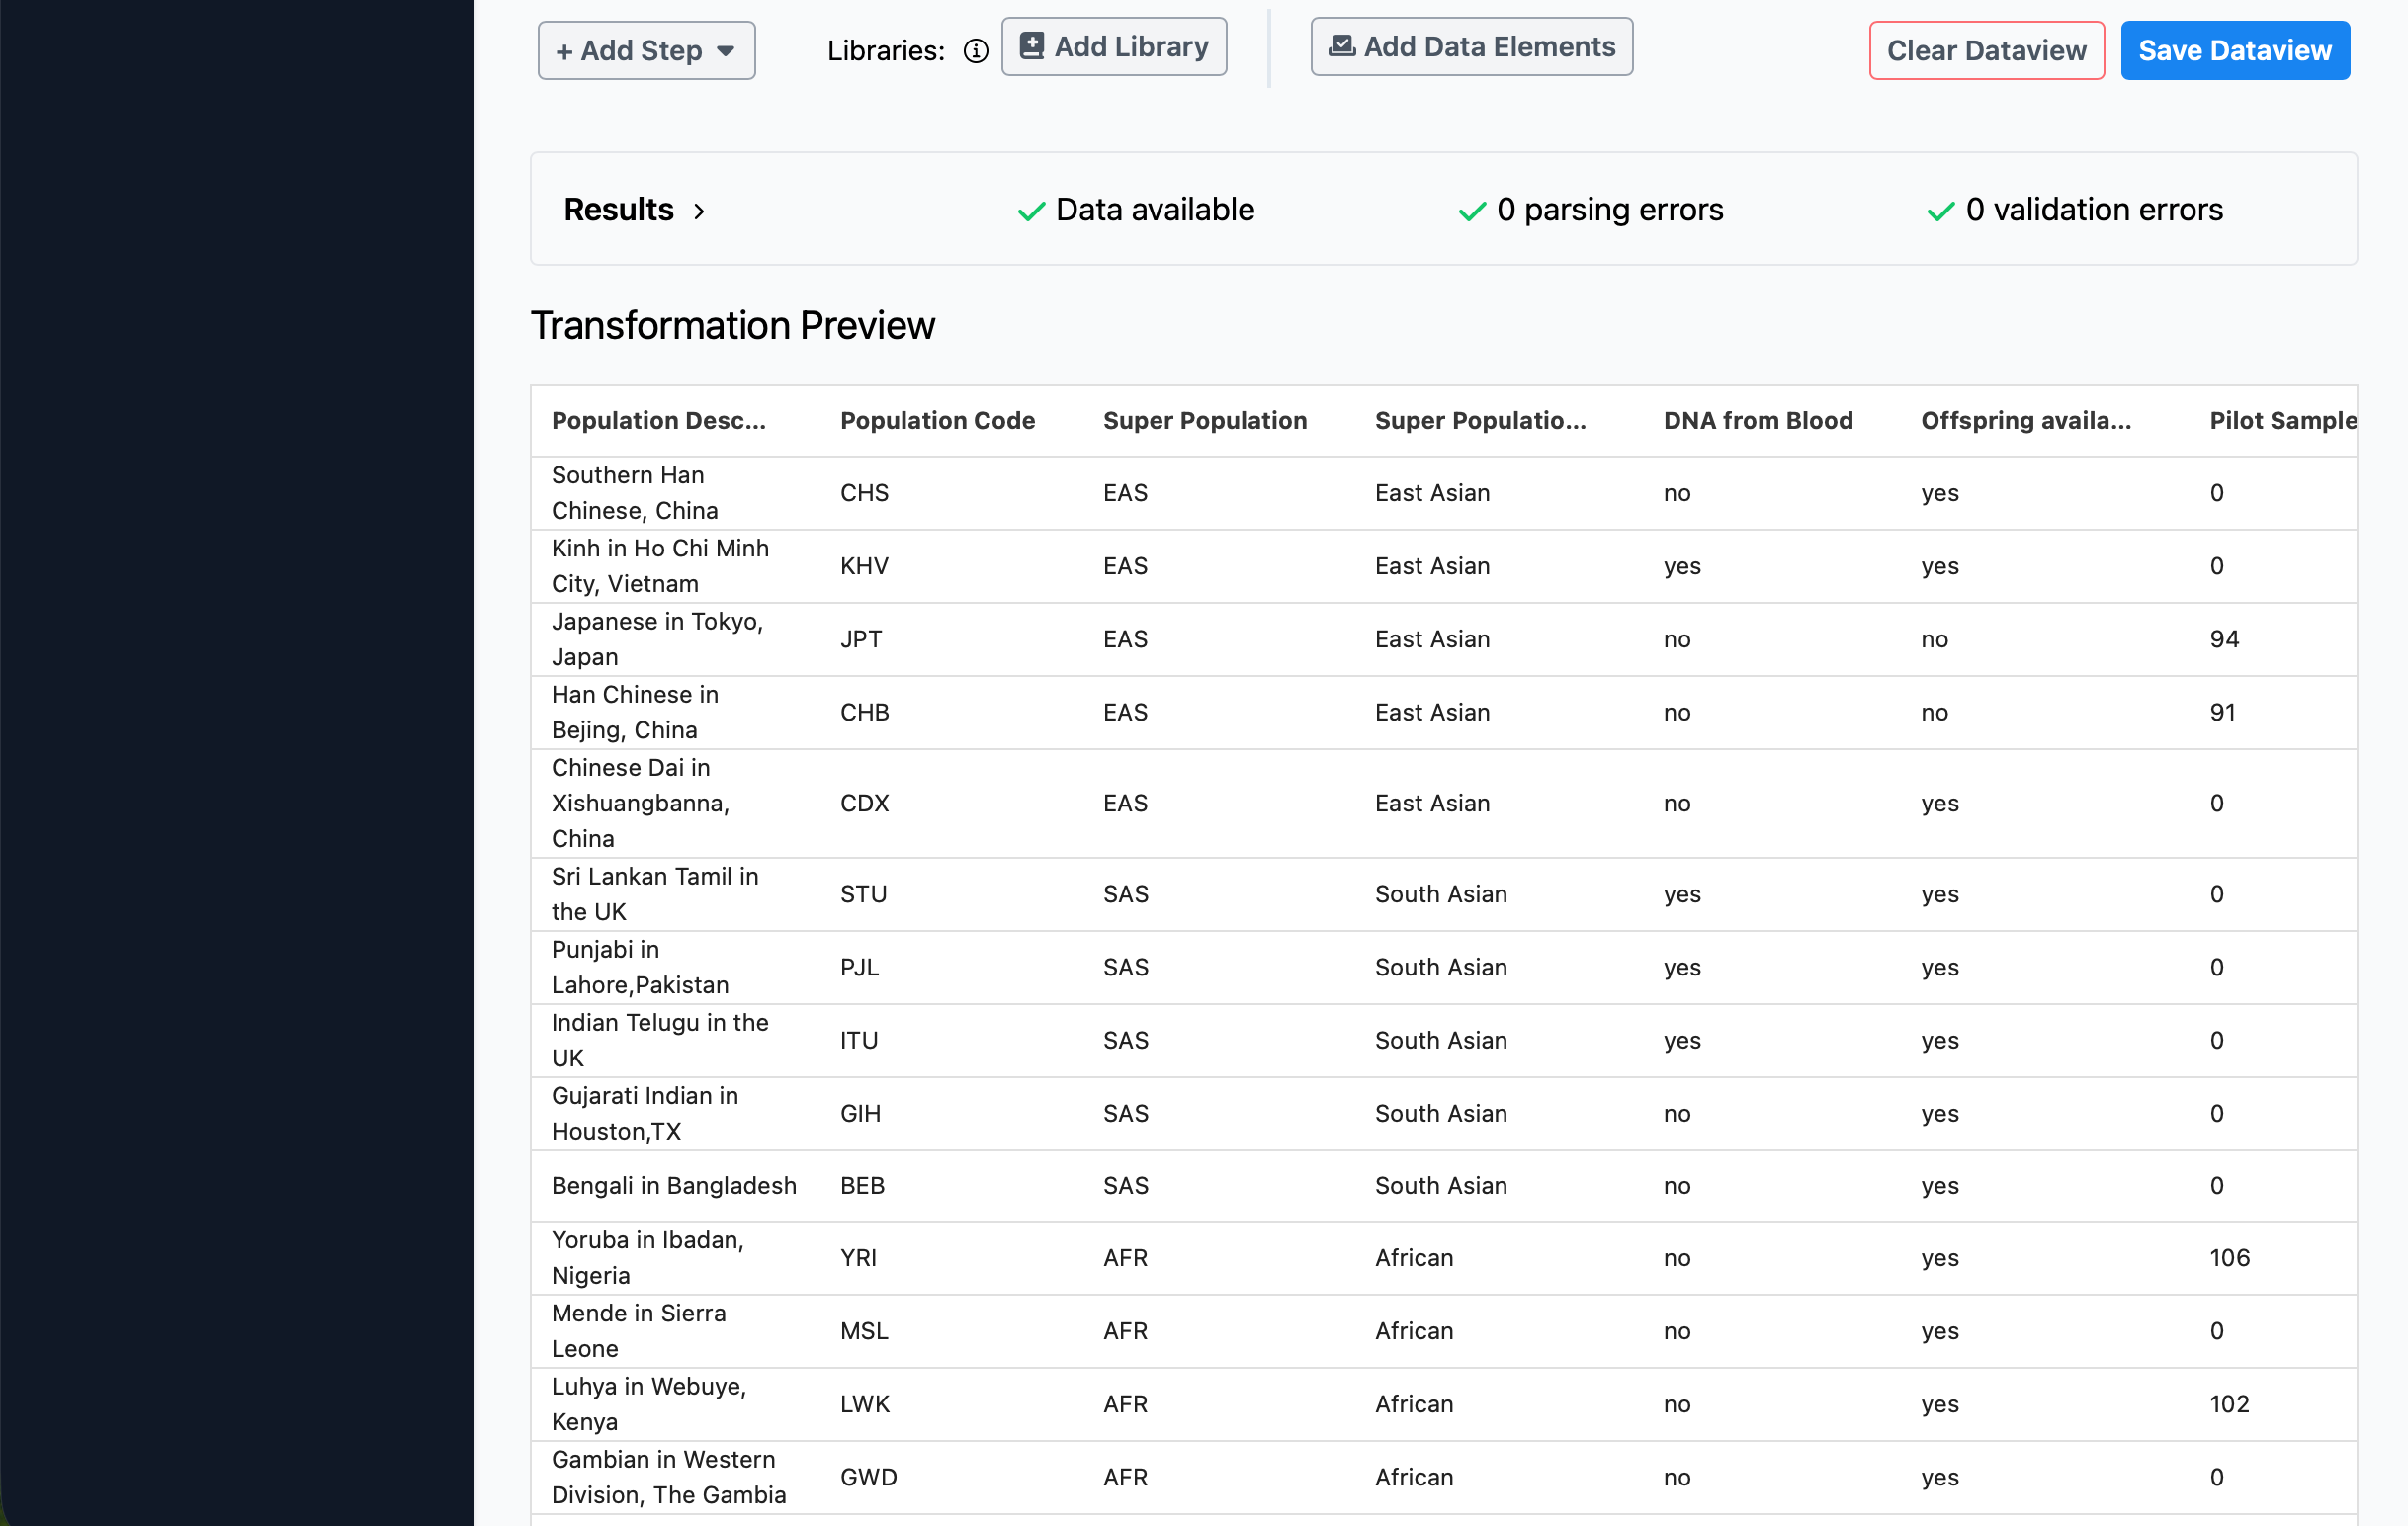
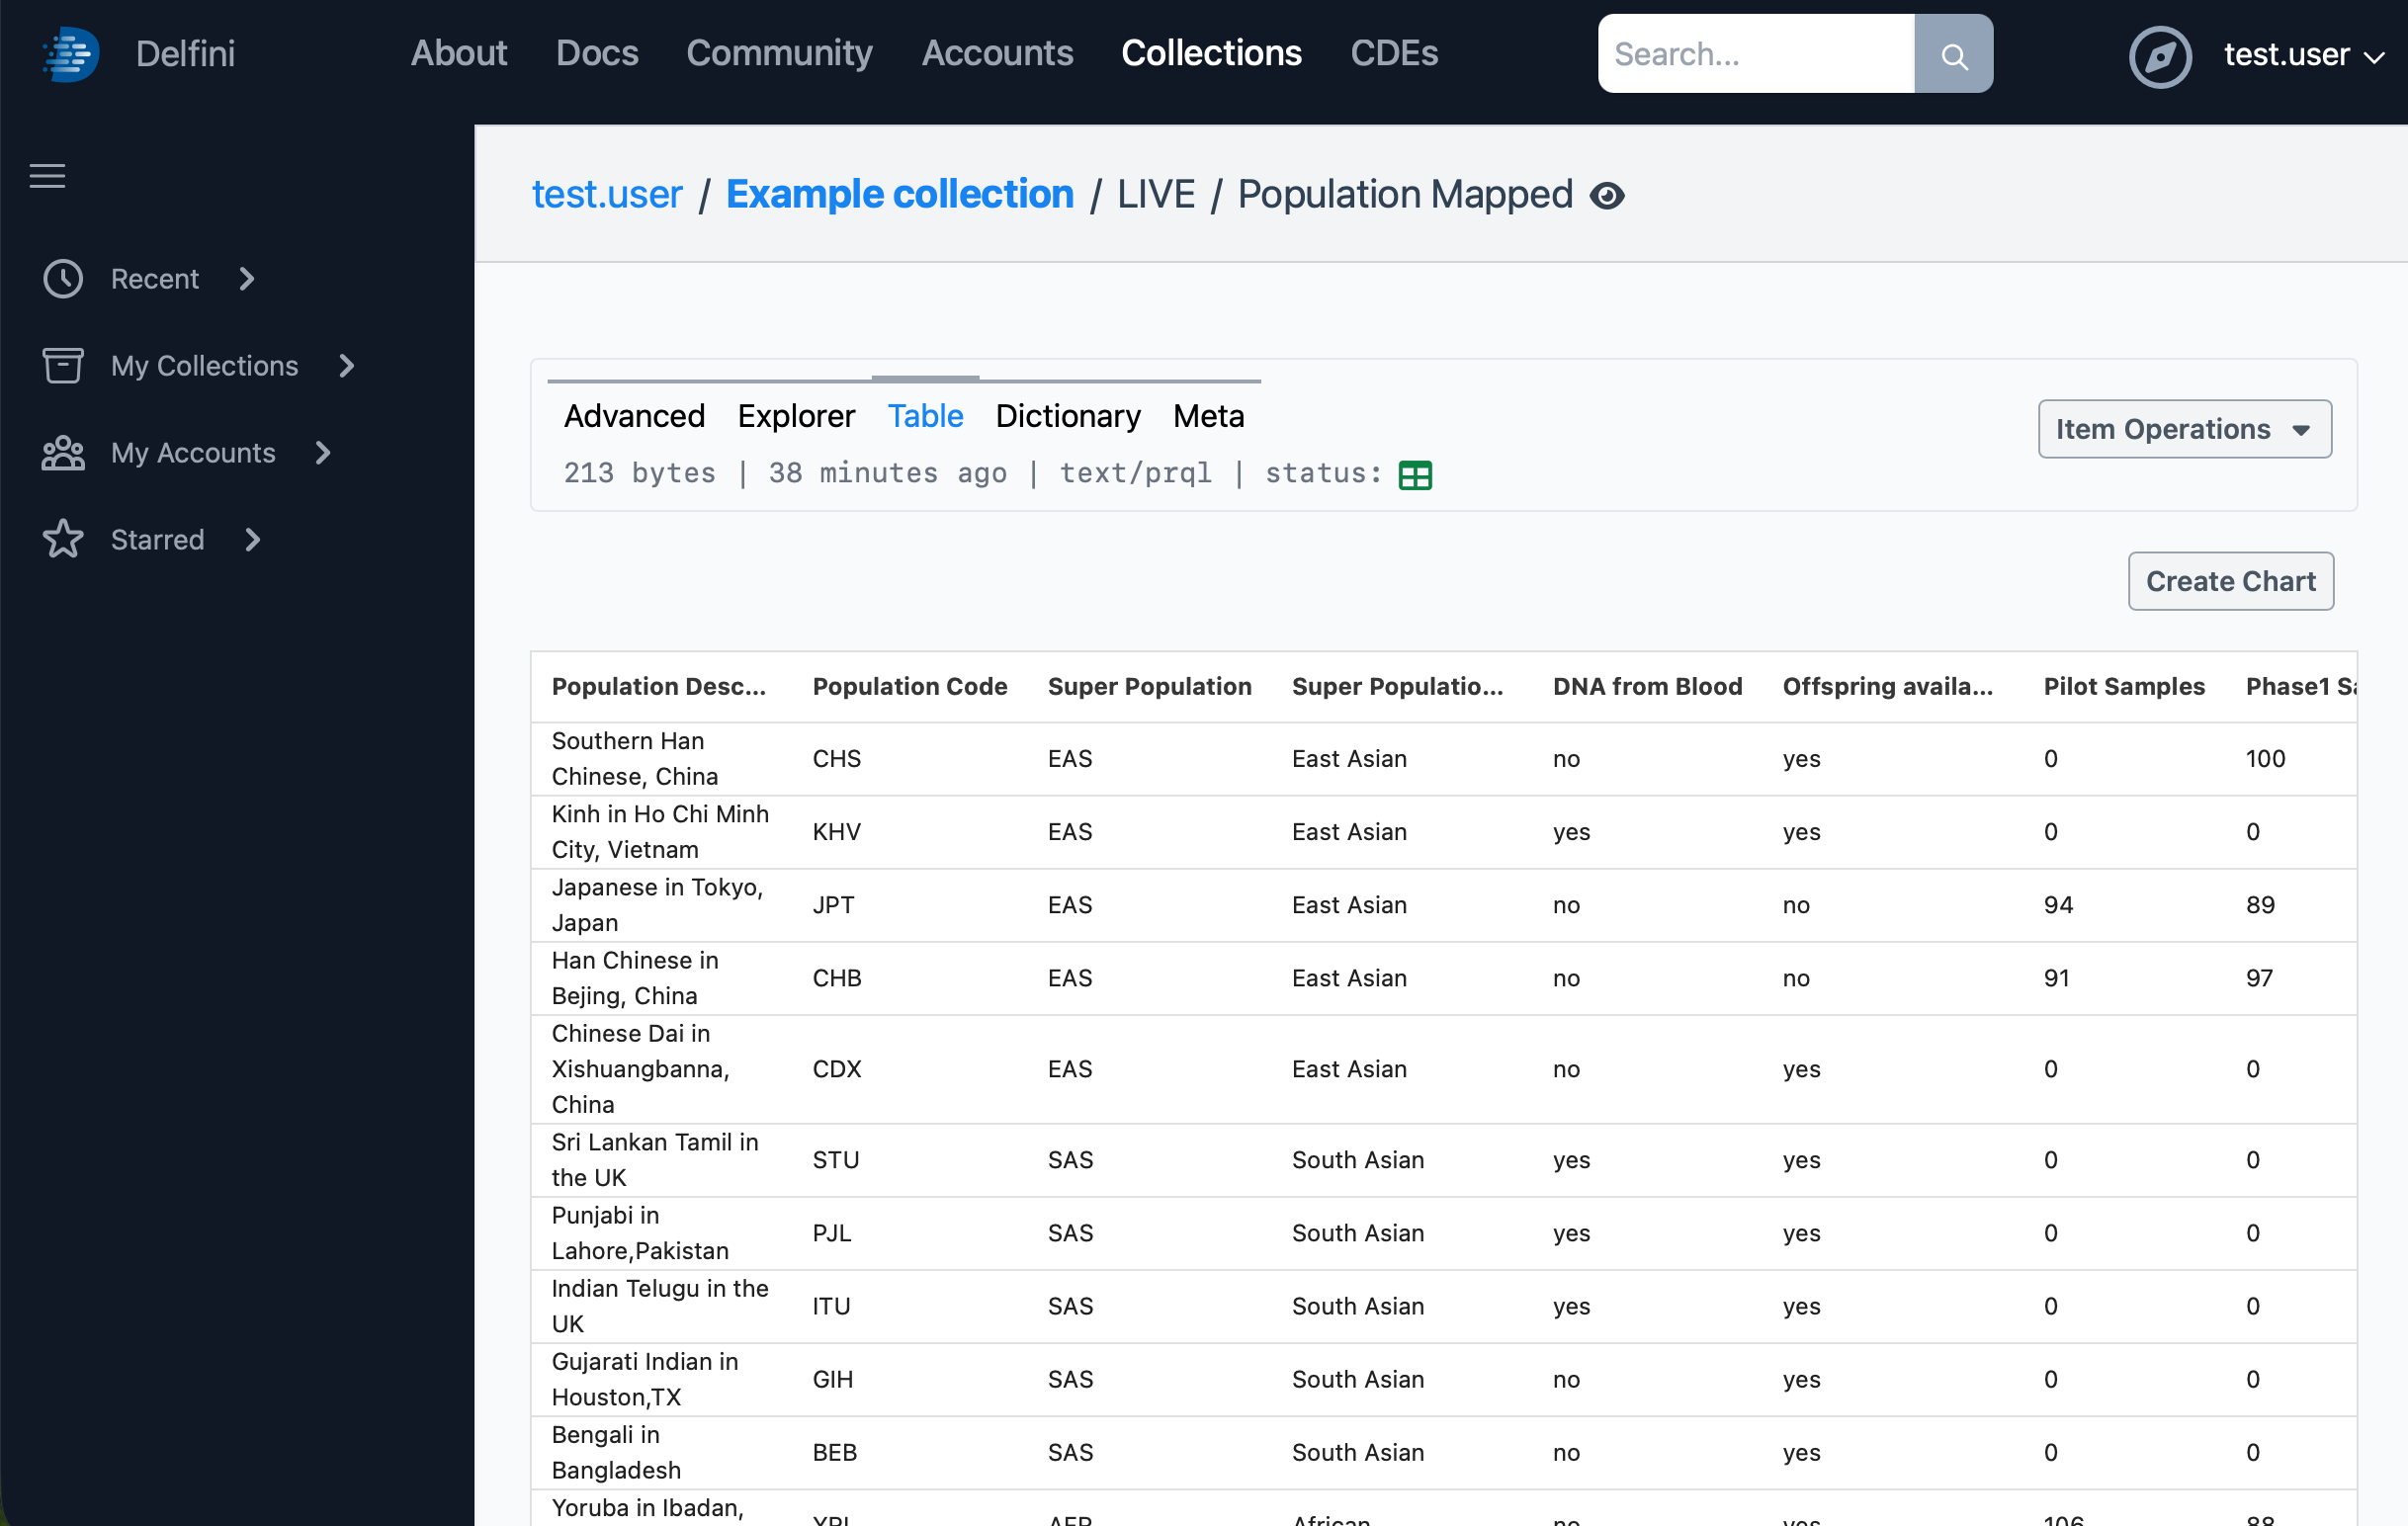
Finally, we’ll click Save Dataview to ensure that we’ve saved our work. To confirm, scroll to the top of the page, click the Table tab, and browse the full data table.
Previous: Collections and Links - Next: Data Visualization